


Radial interpolation of GPS and leveling data of ground deformation in a resurgent caldera: application to Campi Flegrei (Italy)
Bevilacqua A., A. Neri, P. De Martino, R. Isaia, A. Novellino, F. D’Assisi Tramparulo & S. Vitale (2020).
Journal of Geodesy, 94/2, Article 24, https://doi.org/10.1007/s00190-020-01355-x.
Abstract
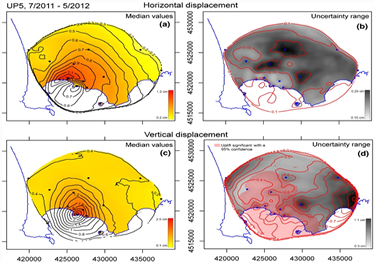
This study presents a new method, called the Radial Interpolation Method, to interpolate data characterized by an approximately radial pattern around a relatively constrained central zone, such as the ground deformation patterns shown in many active volcanic areas. The method enables the fast production of short-term deformation maps on the base of spatially sparse ground deformation measurements and can provide uncertainty quantification on the interpolated values, fundamental for hazard assessment purposes and deformation source reconstruction. The presented approach is not dependent on a priori assumptions about the geometry, location and physical properties of the source, except for the requirement of a locally radial pattern, i.e., allowing multiple centers of symmetry. We test the new method on a synthetic point source example, and then, we apply the method to selected time intervals of real geodetic data collected at the Campi Flegrei caldera during the last 39 years, including examples of leveling, Geodetic Precise Traversing measurements and Global Positioning System. The maps of horizontal displacement, calculated inland, show maximum values lying along a semicircular annular region with a radius of about 2–3 km in size. This semi-annular area is marked by mesoscale structures such as faults, sand dikes and fractures. The maps of vertical displacement describe a linear relation between the maximum vertical uplift measured and the volume variation. The multiplicative factor in the linear relation is about 0.3 × 10⁶ m3/cm if we estimate the proportion of the ΔV that is captured by the GPS network onland and we use this to estimate the full ΔV. In this case, the 95% confidence interval on K because of linear regression is ± 5%. Finally, we briefly discuss how the new method could be used for the production of short-term vent opening maps on the base of real-time geodetic measurements of the horizontal and vertical displacements.
Devi effettuare l'accesso per postare un commento.