


UAS-based mapping of the deposit left by a small-scale gravity-driven flow occurred during the paroxysm of July 3, 2019, in the Rina Grande area, on the upper E flank of Stromboli (Italy).
Andrea Bevilacqua(1), Mattia de’ Michieli Vitturi(1), Luca Nannipieri(1), Massimiliano Favalli(1), Alessandro Fornaciai(1), Lucas Corna(1), Federico Di Traglia(2), Patrizia Landi(1), Augusto Neri(1), Massimo Pompilio(1). https://doi.org/10.13127/stromboli/rinagrandeflow
- 1 Istituto Nazionale di Geofisica e Vulcanologia, Sezione di Pisa, Pisa, Italy
- 2 Istituto Nazionale di Geofisica e Vulcanologia, Osservatorio Vesuviano, Napoli, Italy
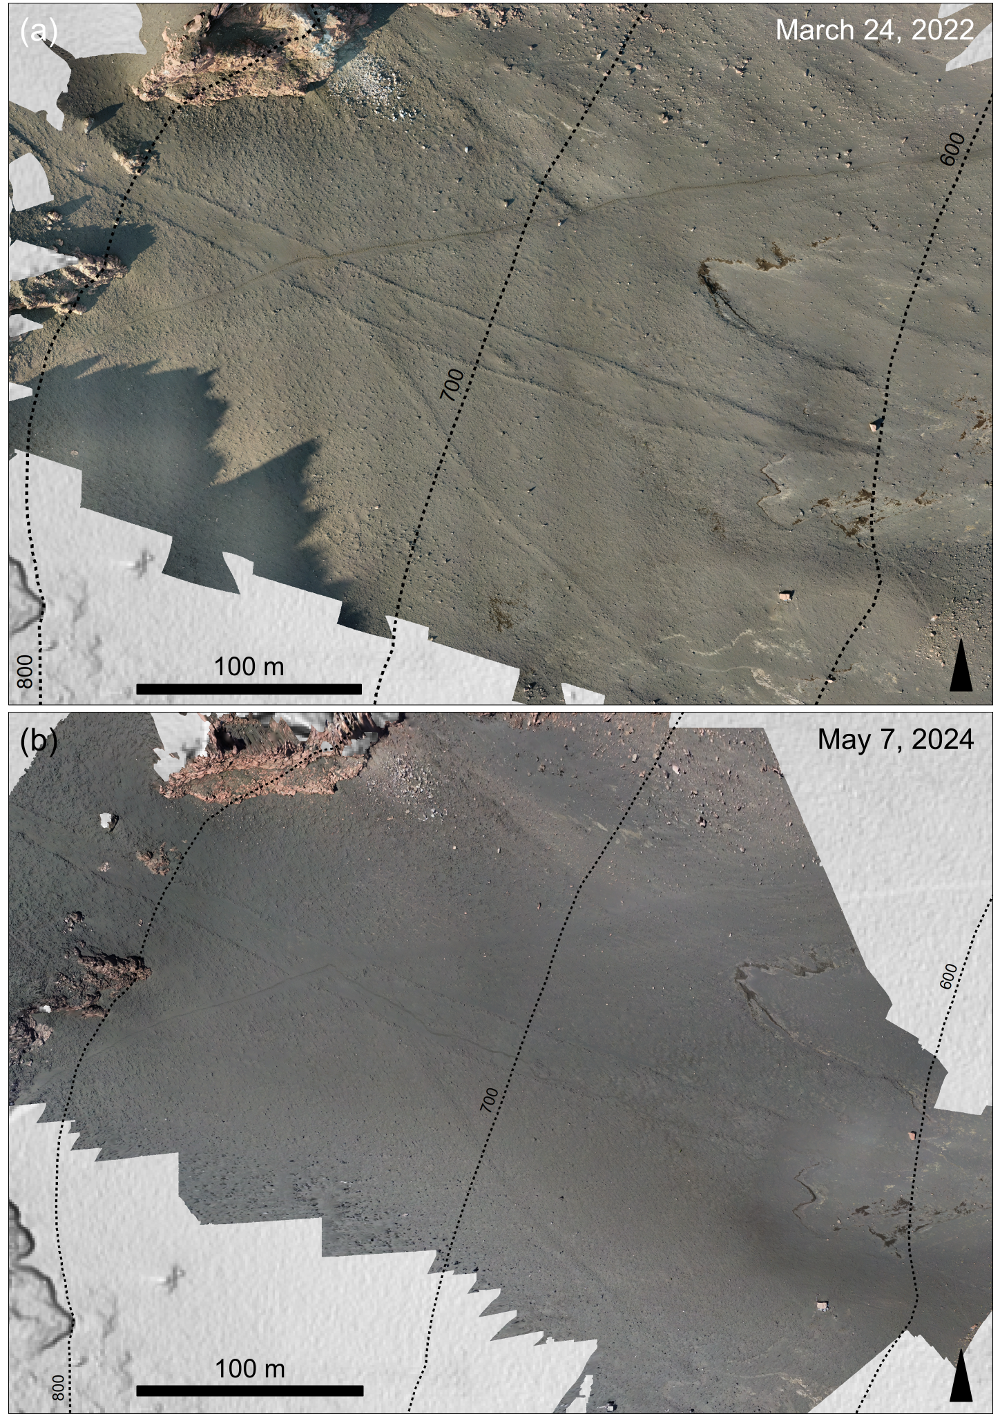
This dataset consists of two UAS-based orthomosaics of the deposit left by a small gravity-driven flow (Figure 1), which affected the Rina Grande area during the paroxysm of July 3, 2019. Rina Grande is the upper portion, i.e., above 450 m a.s.l., of a large depression scar on the ESE flank of Stromboli. This area is characterized by medium slopes and a smooth texture, mean slope of ca. 30°, covered by loose deposits, consisting mainly of sands and gravel linked to erosion and transport in the depression (Apuani et al. 2005; Fornaciai et al., 2010).
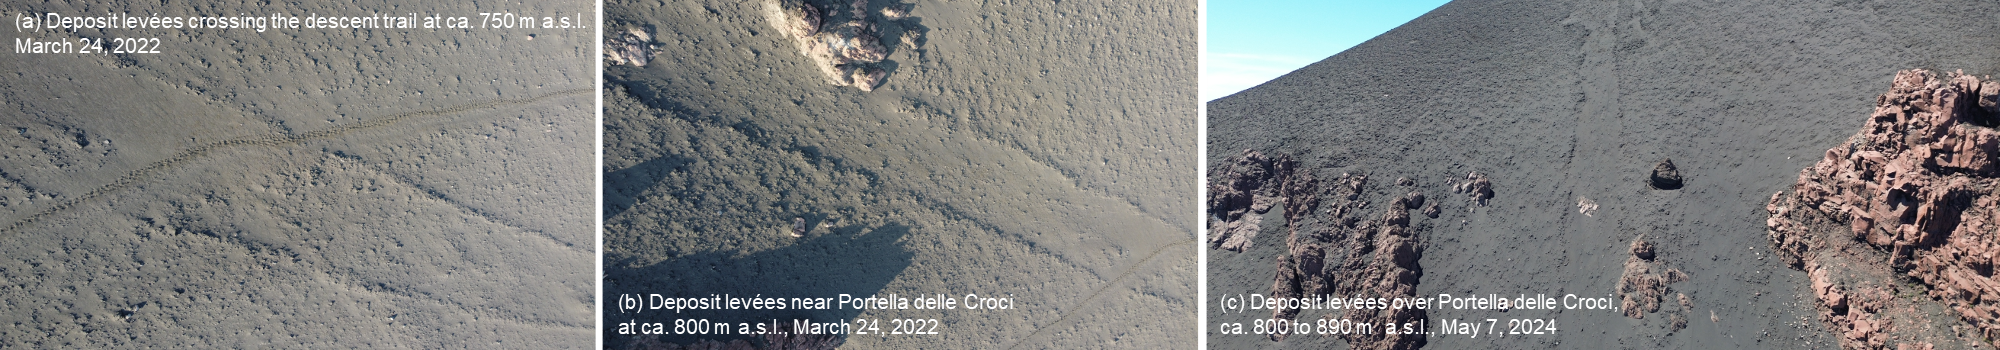
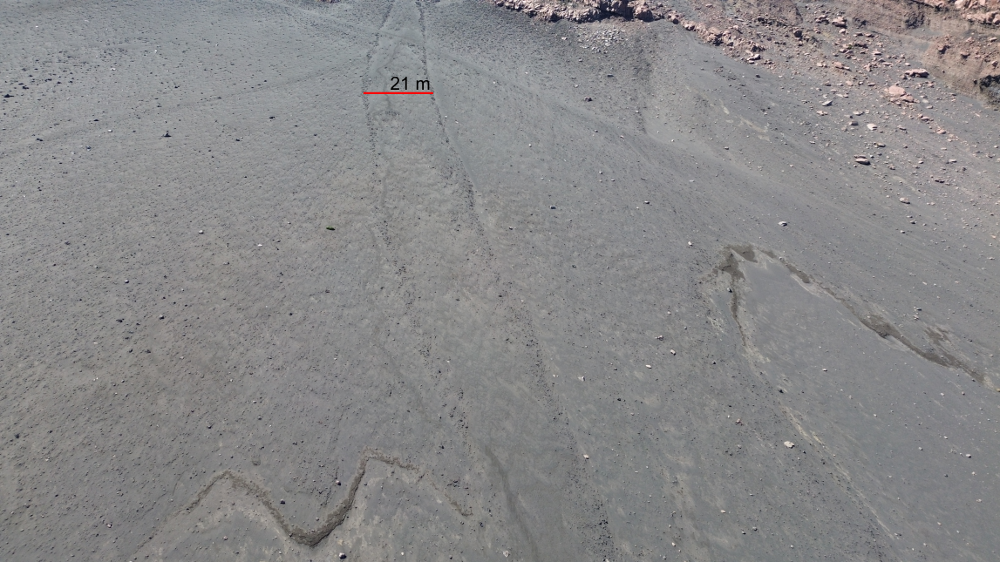
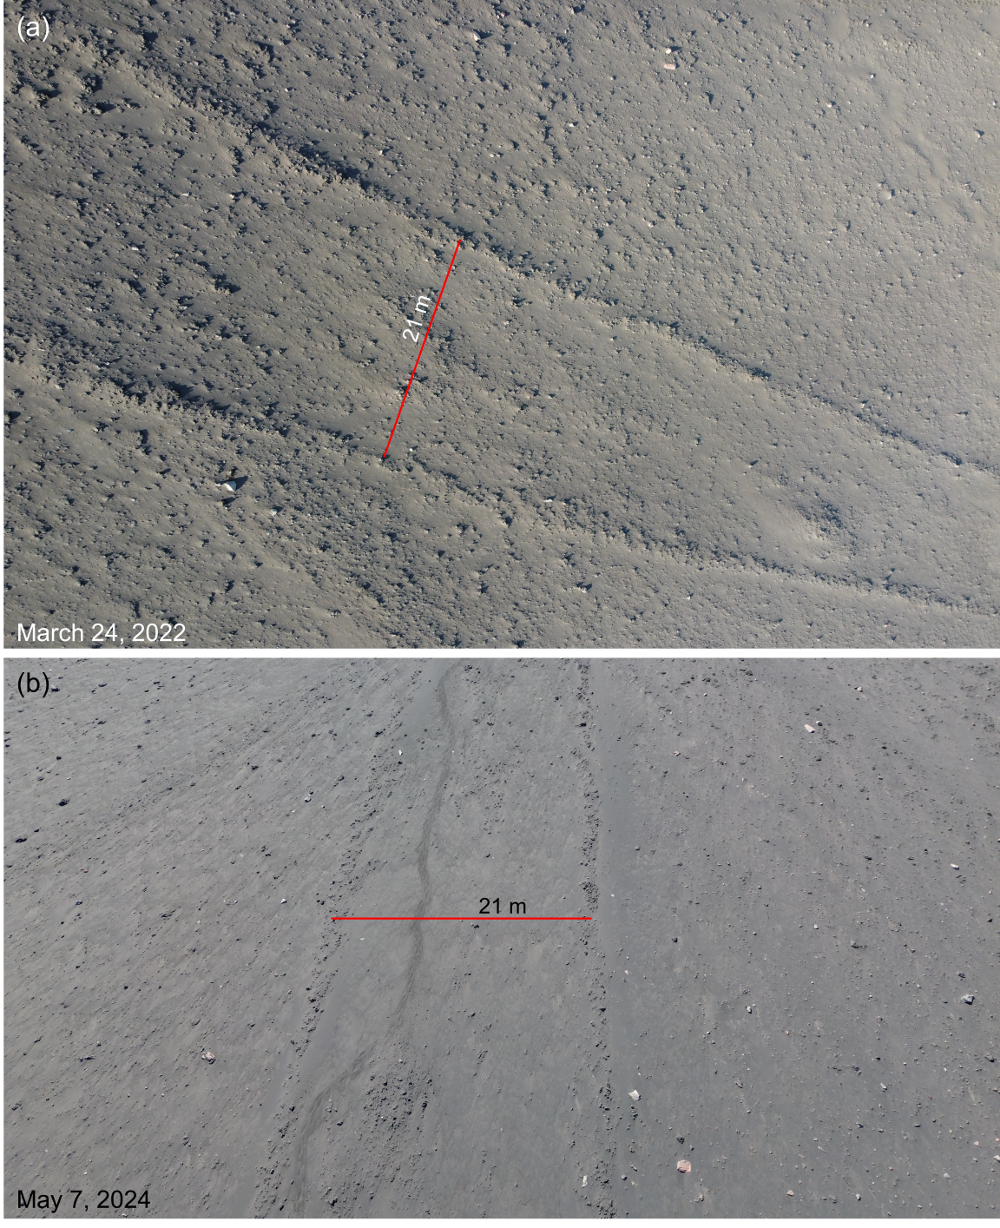
Concerning the July 3, 2019 Rina Grande flow deposit, Giordano and De Astis (2021) described “incandescent slides” formed from the welded to incipiently welded spatter covered the summit, one of which was very elongated along the Rina Grande and was related to the bushfires triggered downslope. In particular, they documented a dark ground hugging cloud related to a “glowing avalanche” down Rina Grande during the paroxysm. Andronico et al. (2021) performed a field survey on the flow deposit a few weeks after the paroxysm. They reported the deposit was a few meters wide and up to 0.5 m-thick, stretching down the E flank to 600 m a.s.l. Bisson et al. (2023) studied an unpublished UAS-based orthomosaic at 8 cm resolution, made from a UAS survey carried out a few weeks after the paroxysm. They measured the total Rina Grande flow deposit length as 500 m: it started at 890 m a.s.l., reached a maximum width of 21 m at 710 m a.s.l. (see Figure 2 from our surveys), and halted at 599 m a.s.l.. The flow deposit was primarily identified thanks to its lateral levées, which were described to converge into a lobe at the runout distance (see Figure 3 from our surveys).
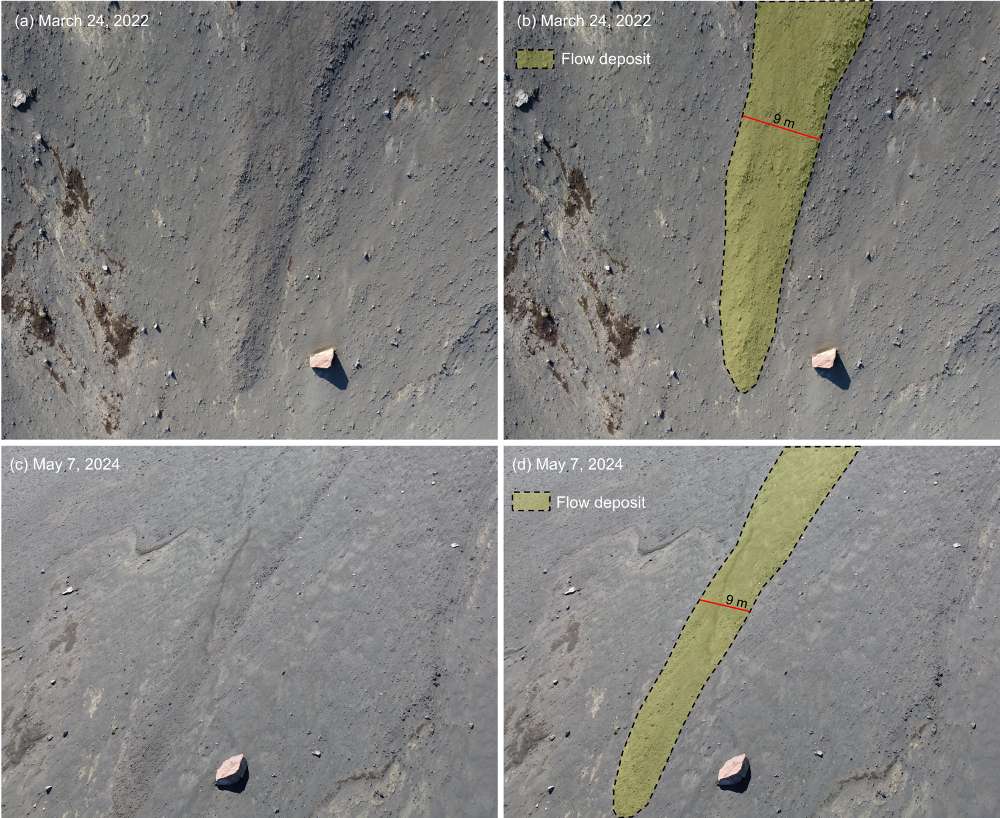
Our surveys confirmed that width and length measures made on the 2019 data were still appreciable after almost 4 years. In particular, on March 24, 2022, we carried out a first UAS survey over the Rina Grande area (Figure 1a). The survey was conducted by a DJI Mini 2: the mean flight elevation was 66 m above ground level and 139 nadiral photographs were acquired. The orthomosaic covered an area of 0.2 km2 at 2.5 cm resolution. Then, on May 7, 2024, a second UAS survey was carried out on the fraction of the Rina Grande area where the deposit was located (Figure 1b). In this case the survey was conducted by a DJI Mini 3: the mean flight elevation was 67 m above ground level and 115 photographs were acquired with manually varied pitch angles. In this case the orthomosaic covered an area of 0.15 km2 at 3.1 cm resolution.
The photographs acquired during the two UAS surveys were used for generating the Digital Surface Model and the orthophotos of the area through Structure from Motion and Multi-view Stereo Matching algorithm implemented in the Agisoft Metashape Professional version 1.6.2 software. Unfortunately, the two surveys were conducted without a simultaneous GPS campaign or dGPS corrections, and therefore it is not possible to accurately measure the errors of the 3D models. However, these orthomosaics describe the Rina Grande flow deposit at centimetric resolution and they document the gradual weathering and erosion of the flow deposit 33 and 46 months after its emplacement.
In the 2022 survey, the area of the deposit below 800 m a.s.l. was ca. 7000 m2; by assuming that between 800 and 890 m a.s.l. the area incremented linearly with the difference in quote, we obtain an indicative total area of ca. 7800 m2. Preliminary analysis of the DSM differences between the 2022 survey and the 2012 DEM indicated that the lobe and levées had thicknesses up to 0.2-0.3 m, i.e., about half of the maximum deposit thickness measured in 2019 by Andronico et al. (2021). The areas between the levées had negligible deposit thickness. Similar DSM differences between the 2024 survey and the 2012 DEM provided significantly lower results, that were at the same scale of reconstruction error and nevertheless indicated further weathering progresses. In summary, by assuming average an thickness inside the mapped area, we obtain 3900 m3 with a 0.5 m thickness, 2340 m3 with a 0.3 m thickness, and 780 m3 with a 0.1 m thickness, indicating a volume one-two orders of magnitude smaller than the deposit-derived PDC occurred on 11 Sep. 1930 (Di Roberto et al., 2014; Neri et al., 2025).
DOWNLOAD:
Orthomosaics (a) – March 24, 2022
Orthomosaics (b) – May 7, 2024
Devi effettuare l'accesso per postare un commento.