


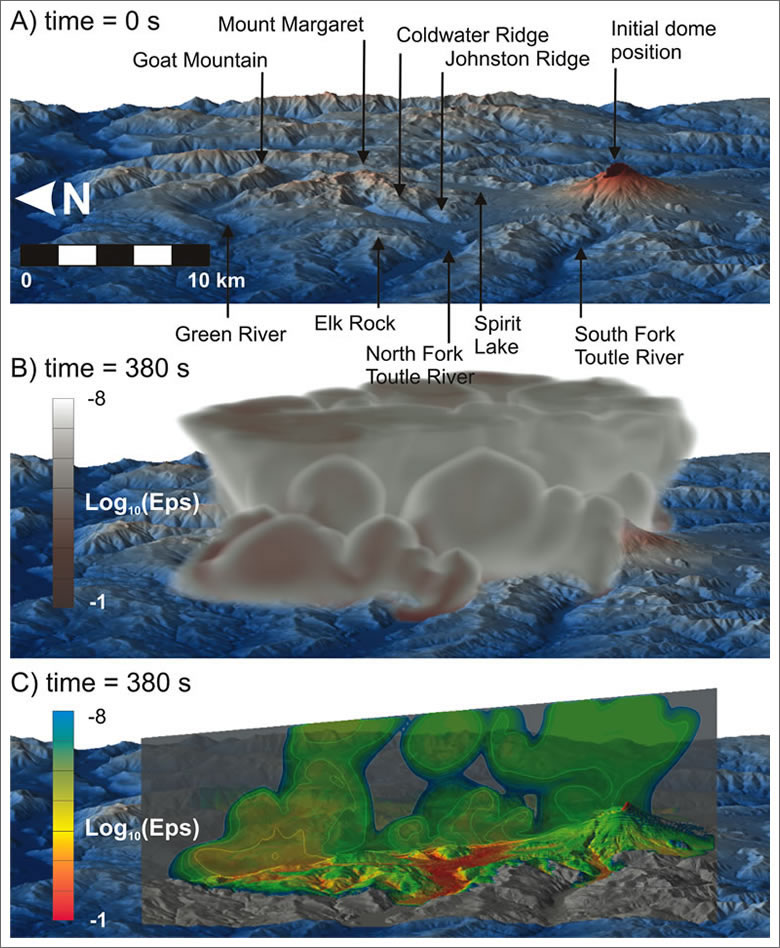
Multiphase-flow numerical modeling of the 18 May 1980 lateral blast at Mount St. Helens (USA)
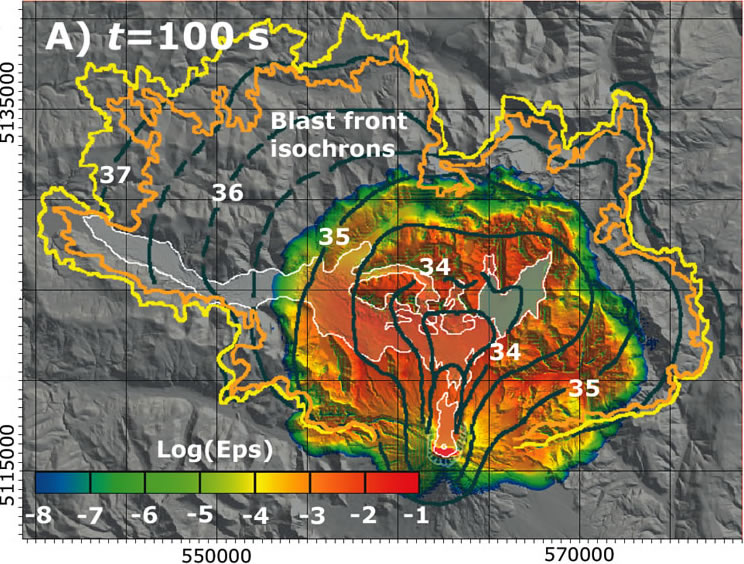
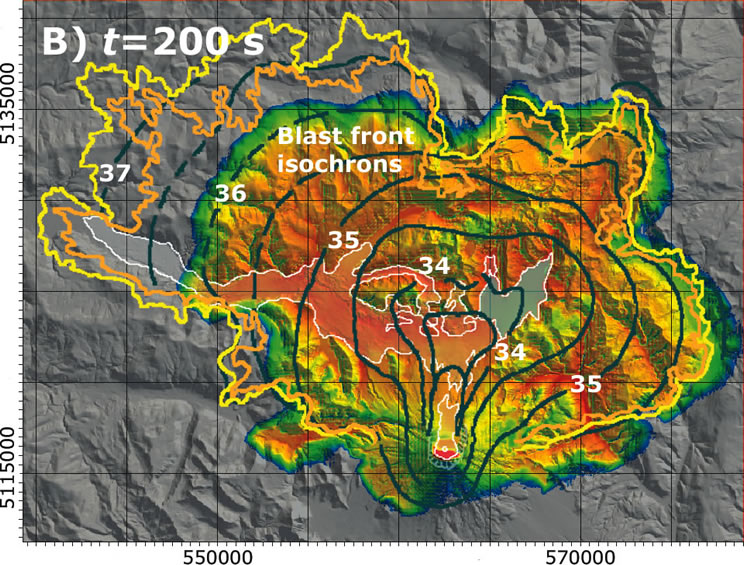
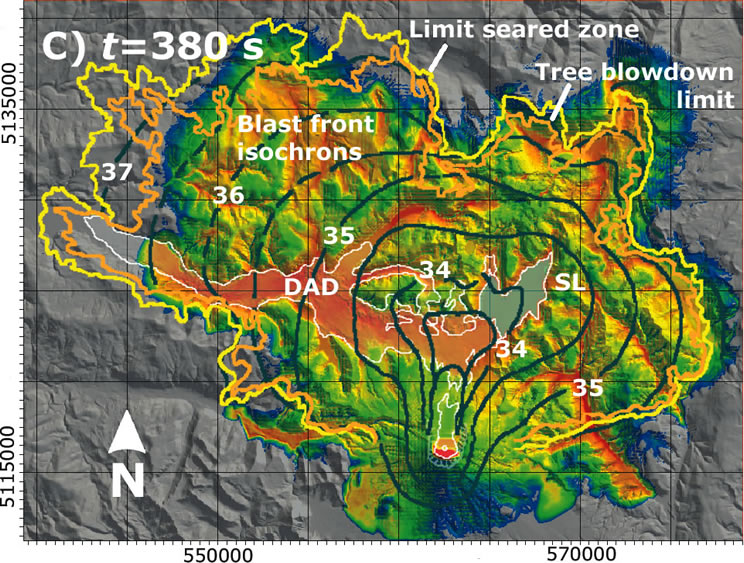
Map of the logarithm of the total particle concentration at 10 m above the ground level, at time (t) a) 100 s, b) 200 s and c) 380 s after the onset of the blast. Superimposed outlines (modified after Moore and Rice, 1984, Figures 10.2 and 10.7): White line, boundary of debris avalanche deposit from the edifice collapse (DAD); Orange line, tree blow-down limit; Yellow line, seared zone boundary; Dark green, advancement of the flow front inferred from direct and satellite observations. Isochrons are every half minute (the isochron 35 means a time of 08:35.0 h LT.). First explosion was at 08:32.7. The second, main pulse started at 08:33.7 and bypassed the first at 08:34.5.
© 2011 Geological Society of America
Focus
Thirty years after the 1980 eruption of Mount St. Helens, supercomputer simulations have allowed us to reproduce and analyze the large-scale features of the May 18 blast, which devastated a wide area of 600 km2 north of the volcano and killed fifty-seven people.
Initial conditions, triggering the violent explosion of the magmatic mixture, have been derived from the wide geological dataset available for this eruption, which is one of the most studied and documented in volcanology.
The three-dimensional computer model was then able to describe the propagation of the eruptive cloud, made up of high-temperature gases, ash, pumices and rocks fragments, over the mountainous region surrounding the volcano, and to correctly reproduce the flow front velocity, runout (the maximum distance reached by the cloud) and impact.
The results demonstrate that, where detailed geological constraints are available and thanks to the availability of high-performance supercomputers, physical models can fairly accurately reproduce the main large-scale features of blast scenarios. Such an improvement in modeling capability will make it possible to more effectively map potential blast flows at blast-dangerous volcanoes worldwide.
Methods
Numerical simulations have been carried out by exploiting the power of parallel supercomputers to solve the multiphase flow equations of a compressible mixture made up of one multicomponent gaseous phase and four particulate phases, representative of the three main juvenile components plus one for admixed rock particles. The computational domain extends 40 km in longitude (x-axis), 30 km in latitude (y-axis) and 8 km vertically (z-axis) and the numerical grid has 200 m horizontal resolution and 20 m maximum vertical resolution, near the ground, for a total of 8 millions of computational cells. Every single run (simulating about 400 s of the real event) took about 10 thousands hours of CPU time, i.e., about 5 days on 128 AMD cores at 2.4 GHz in parallel execution.
Citation
Esposti Ongaro, T., C. Widiwijayanti, A.B. Clarke, B. Voight, and A. Neri. Multiphase-flow numerical modelling of the May 18, 1980 lateral blast at Mount St. Helens, USA, Geology, June 2011, v. 39 n. 6; p. 535-538; doi:10.1130/G31865.1.
Abstract
Volcanic lateral blasts are among the most spectacular and devastating of natural phenomena but their dynamics are still poorly understood. Here we investigate the best documented and most controversial blast at Mount St Helens on May 18, 1980. By means of 3D multiphase numerical simulations we demonstrate that the blast front propagation, final runout and damage can be explained by the emplacement of an unsteady, stratified pyroclastic density current, controlled by gravity and terrain morphology. Such interpretation is quantitatively supported by large-scale observations at Mount St Helens and will influence the definition and predictive mapping of hazards on blast-dangerous volcanoes worldwide.ntact
Contact
tomaso.ongaro (at) pi.ingv.it
Devi effettuare l'accesso per postare un commento.