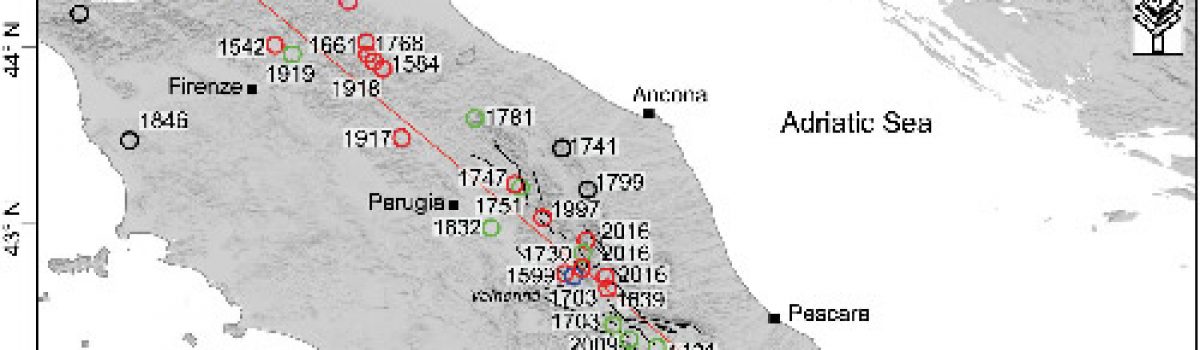
Figure 1. Map of Mw ≥ 6 historical earthquakes along the Apennine mountain chain starting from 1400 CE (from the catalogue CPTI15; Rovida et al., 2016). Black empty circles represent the events located outside the 30‐km half width along the trace of the section (red dashed line) and not considered…
Archiviati
Variable Fault Geometry Suggests Detailed Fault‐Slip‐Rate Profiles and Geometries Are Needed for Fault‐Based Probabilistic Seismic Hazard Assessment (PSHA)
Fault scarps exposed at the surface in the central Italian Apennines formed since the end of the last glacial maximum (LGM). (a) Photograph of a postglacial scarp with example of a scarp profile line; (b) cartoon topographic scarp profile constructed across cartoon fault scarp showing how the throw since the…
Dynamics of shallow hydrothermal eruptions: new insights from Vulcano’s Breccia di Commenda eruption
Three-dimensional view of the eruption sequence after 3.5, 15, 20, 30, 40 and 50 s. Colour scale represents the logarithm in base 10 of the pyroclasts concentration (alpha), along a W–E section and at ground level. Ballistic particles of 8, 16 and 30 cm are drawn with different diameters and…
INGV partecipa al Festival della Scienza di Genova 2018 con la mostra “Il Pianeta dei cambiamenti”
Si inaugura oggi e prosegue fino al 4 novembre la mostra ideata da Spina Cianetti, Giuliana D’Addezio e Daniele Melini ed ospitata nella prestigiosa sede del Palazzo Ducale, Piazza Matteotti 9. La mostra ripercorre la nascita, lo sviluppo e la consacrazione della teoria della tettonica delle placche. Attraverso una serie…
New constraints on the evolution of the inner Northern Apennines by K-Ar dating of Late Miocene-Early Pliocene compression on the Island of Elba, Italy
Detailed geological map of the study area along the northeastern shore of Golfo Stella and location of dated samples. The main brittle and brittle‐ductile deformation zones of the area are indicated. (a) Location of sample ELB2 in the serpentinitic and nonmetamorphic hanging wall of the Capo Norsi‐Monte Arco Thrust. (b)…
PeakLocator 1.0, a web tool to compare extreme value areas among maps
Schematic representation of the PL1.0 procedure considering the maps of the variable 1 and 2, whose areas of extreme values are A1,1 and A2,1, obtained setting alfa1=alfa2=1. We remark that, in the insert representing the output, the bounded grey area represents the region where the values of both the variables…
Devi effettuare l'accesso per postare un commento.