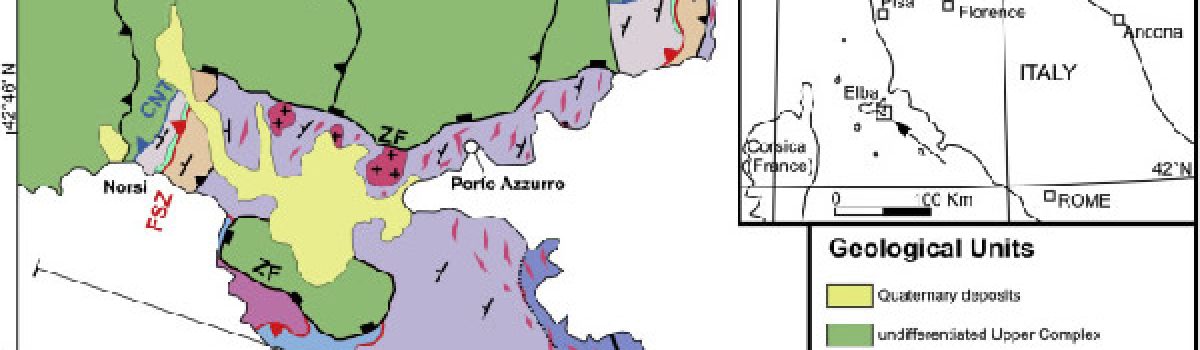
Fig. 2. Views of the upper eastern slope of Etna preceding the 11 February 2014 PDC (a, b, and c are frames from the EMCT camera showing the January and February 2014 lava flows descending from the NSEC upper eastern slope). a) Lava flow from the effusive vent (yellow arrow)…
News
Application of an ultra-wide band sensor-free wireless network for ground monitoring
Fig. 10. A: location of the Wi-GIM nodes and the RTS installed at Roncovetro; nodes 1, 2 and 7 are places outside the landslide in a stable location. B, C: Wi-GIM nodes and RTS prisms. Intrieri E., G. Gigli, T. Gracchi, M. Nocentini, L. Lombardi, F. Mugnai, W. Frodella, G.
RIAPERTURA DEI TERMINI – Assegni di ricerca – Progetti di Alta Formazione POR FSE 2014/2020 – Giovanisì – Regione Toscana
Sono stati pubblicati in data 03 Aprile 2018, i decreti per la riapertura dei termini per la selezione di 2 candidati che collaboreranno ai progetti GEOMON e ASPIS appartenenti al Programma di Intervento Nuove tecnologie per il monitoraggio del territorio e la difesa dai rischi naturali. Il programma, presentato da…
A MIS 9/MIS 8 speleothem record of hydrological variability from Macedonia (F.Y.R.O.M.)
Fig. 1. Upper panel: location of Ohrid and of other sites mentioned in the text. Lower panel: schematic geological map of the site and location of the cave entrance. Regattieri E., G. Zanchetta, I. Isola, P. Bajo, C. Boschi, N. Perchiazzi, R.N. Drysdale, J.C. Hellstrom, A. Francke, B. Wagner (2018).Global…
A database of the coseismic effects following the 30 October 2016 Norcia earthquake in Central Italy
Simplified structural scheme of the central Apennines inner zone, showing the main Quaternary normal faults (black lines, tick on downthrown side), Miocene-Pliocene thrusts (blue lines), the location of the M>5 events of the 2016-2017 seismic sequence, together with their focal mechanisms (available at http://cnt.rm.ingv.it/tdmt). The thin red lines are…
Conduit stability effects on intensity and steadiness of explosive eruptions
Instability index versus mass discharge rate, for simulations performed with phonolitic, trachytic, dacitic and rhyolitic magmas (in titles). We present here results related to a set of simulations with variable values of inlet pressure (115–135 MPa) and water content (4.0–6.0 wt.% for phonolitic and trachytic magmas; and 4.5–6.5 wt.% for dacitic and rhyolitic…
Devi effettuare l'accesso per postare un commento.