


Landslide susceptibility mapping by remote sensing and geomorphological data: case studies on the Sorrentina Peninsula (Southern Italy)
Spinetti C., M. Bisson, C. Tolomei, L. Colini, A. Galvani, M. Moro, M. Saroli & V. Sepe (2019).
GIScience & Remote Sensing, DOI: 10.1080/15481603.2019.1587891.
Abstract
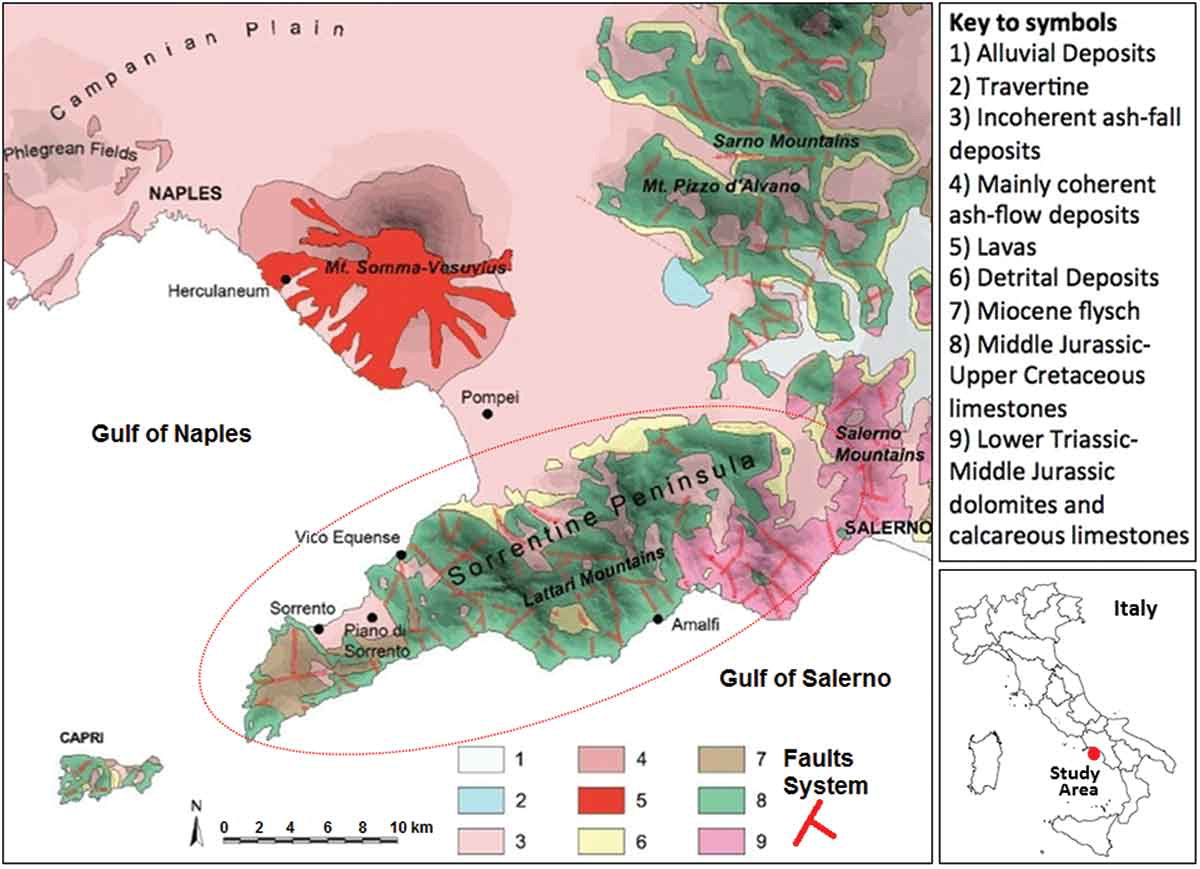
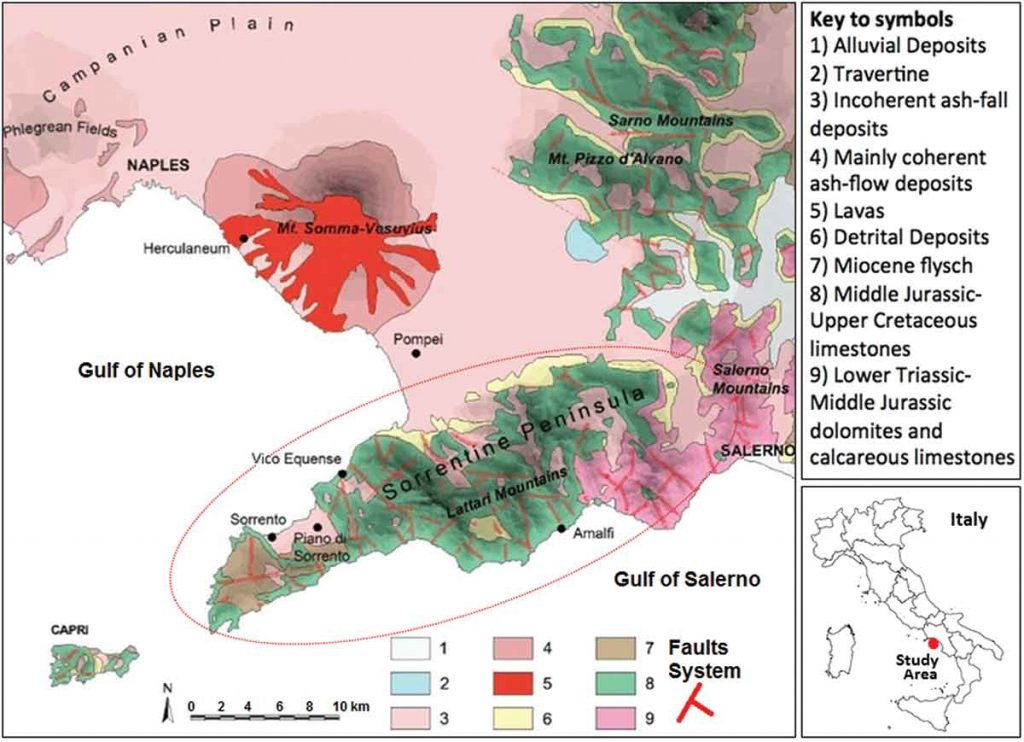
The Sorrentina Peninsula is a densely populated area with high touristic impact. It is located in a morphologically complex zone of Southern Italy frequently affected by dangerous and calamitous landslides. This work contributes to the prevention of such natural disasters by applying a GIS-based interdisciplinary approach aimed to map the areas more potentially prone to trigger slope instability phenomena. We have developed the Landslide Susceptibility Index (LSI) combining five weighted and ranked susceptibility parameters on a GIS platform. These parameters are recognized in the literature as the main predisposing factors for triggering landslides. This work combines analyses conducted on Remote Sensing, Geo-Lithology and Morphometry data and it is organized in the following logical steps: i) Multi-temporal InSAR technique was applied to Envisat-ASAR (2003–2010) and COSMO-SkyMed (2013–2015) datasets to obtain the ground displacement time series and the relative mean ground velocity maps. InSAR allowed the detection of the areas that are subjected to ground deformation and the main affected municipalities; ii) Such deformation areas were investigated through airborne photo interpretation to identify the presence of geomorphological peculiarities connected to potential slope instability. Subsequently, some of these peculiarities were checked on the field; iii) In these deformation areas the susceptibility parameters were mapped in the entire territory of Amalfi and Conca dei Marini and then investigated with a multivariate analysis to derive the classes and the respective weights used in the LSI calculation. The resulting LSI map classifies the two municipalities with high spatial resolution (2m) according to five classes of instability. The map highlights that the high/very high susceptibility zones cover 6% of the investigated territory and correspond to potential landslide source areas characterized by 25°-70° slope angles. A spatial analysis between the map of the historical landslides and the areas classified according to susceptibility allowed testing of the reliability of the LSI Index, resulting in 85% prediction accuracy.
Devi effettuare l'accesso per postare un commento.