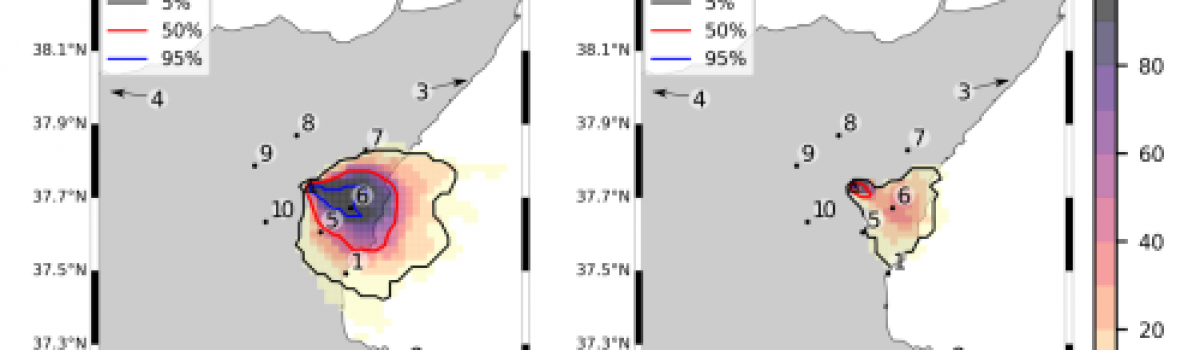
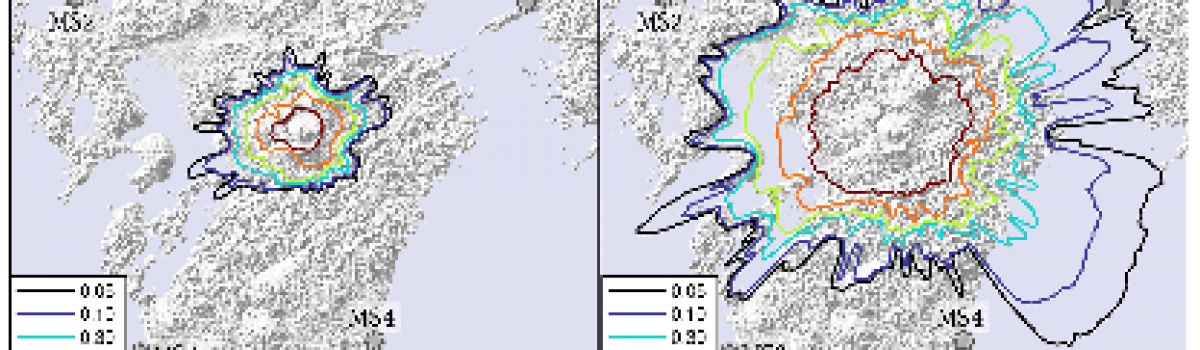
Fig. 4. Stratigraphic constrained cluster analysis of selected calcareous nannofossils from core ND14Mbis for the 10.95–7.22 kyrs time interval, compared with lightness values (L*). Colour bands represent abundance values (%). Cascella A., S. Bonomo, F. Lirer, G. Margaritelli, H. Checa, I. Cacho, L. D. Pena, J. Frigola (2021).Global and Planetary…
News
Environmental and Oceanographic Conditions at the Continental Margin of the Central Basin, Northwestern Ross Sea (Antarctica) Since the Last Glacial Maximum
Figure 1. Bathymetric map of the Ross Sea (modified from [24]). WAIS = West Antarctic Ice Sheet, EAIS = Eastern Antarctic Ice Sheet. The red rectangle indicates the studied area. HR = Hallett Ridge, BA = Bank A, BB = Bank B. Red dots indicate the studied box cores: BC02…
Global Volume Distribution for Subaerial Volcanism on Earth
Global distribution of eruption volumes for VEI 0 – 8 eruptions. a) Distributions obtained by maintaining separation between eruptions belonging to different VEI classes. The red and orange symbols on one side, and the blue and green symbols on the other side, refer to data with only consistent, or…
Deep Magma Transport Control on the Size and Evolution of Explosive Volcanic Eruptions
FIGURE 1. Observed (∙) vs. simulated (∘) magnitude-intensity distribution. Observed data from the LaMEVE database (Crosweller et al. 2012; Brown et al. 2014; www2.bgs.ac.uk/vogripa/, accessed in February 2019). Magnitude and intensity as in Pyle (2015), also defined in the Methods. The space of variables has been sampled through a Latin…
Thematic vent opening probability maps and hazard assessment of small-scale pyroclastic density currents in the San Salvador volcanic complex (El Salvador) and Nejapa-Chiltepe volcanic complex (Nicaragua)
Figure 8. Inundation probability of small-scale PDC at the San Salvador volcanic complex derived from the systematic application of the branching energy cone model (Aravena et al., 2020a) and the vent opening probability map shown in Fig. 4. (a) Mean value. (b) 5th percentile. (c) 95th percentile. Inundation probability is…
Eruption type probability and eruption source parameters at Cotopaxi and Guagua Pichincha volcanoes (Ecuador) with uncertainty quantification
Cotopaxi volcano. Probability density functions of conditional probabilities for (a) the next eruption and (b) the next 100 years. For each graph, it is reported on the x-axis the decision maker’s response (in %), and on the y-axis the distributions of, respectively, the Classical Model (red), the Expected Relative…
Devi effettuare l'accesso per postare un commento.