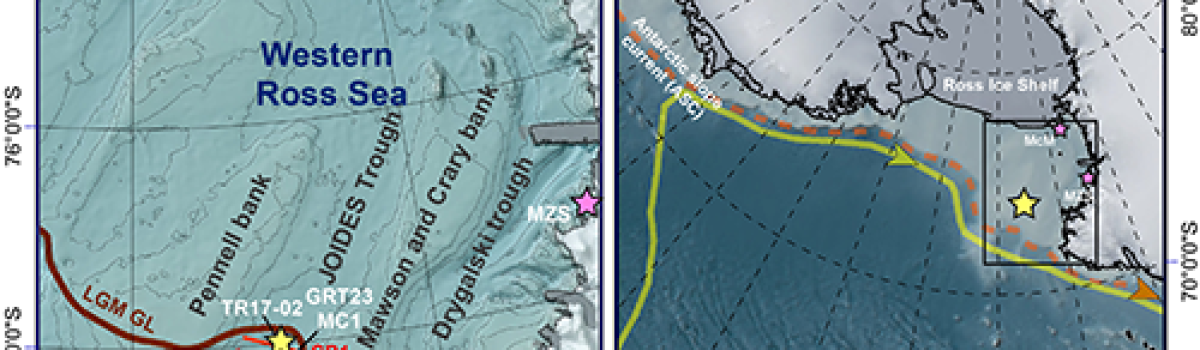
Temporal evolution of the Shannon entropy before and after four lava fountain paroxysms of Mt. Etna during November 2013 all of them marked with vertical red lines. Green region indicates a decay bigger than the 70%. Decay at the moment of the eruption: 98.4%, 98.9%, 97.4%, and 95.1%. Rey-Devesa P., C.
News
Vents opening susceptibility map of the Colli Albani long dormant volcano
Figure 1. Schematic Geological map of the Colli Albani volcano derived from the 1:50,000 scale geodatabase of the Italian official Geological Map (ISPRA; Giordano, Benedetti, et al. 2010). Legend: (0) topographic caldera rim; (1a) Holocene alluvial and coastal deposits; (1b) undefined sedimentary rocks; (2) via dei Laghi maar complex (ca. 200 ka–Holocene);…
Historical explosive activity of Mount Melbourne Volcanic Field (Antarctica) revealed by englacial tephra deposits
(a) Map of the volcanoes in northern Victoria Land. The location of the studied outcrop is labelled with a red star whereas the location of the marine sediment core TR17-08 in Edisto Inlet (Di Roberto et al. 2023) and of the deep ice cores at Talos Dome and Styx…
Scenario-based probabilistic hazard assessment for explosive events at the San Salvador volcanic complex, El Salvador
Probabilistic hazard map of PDC showing the inundation probability conditioned on the occurrence of a small-scale PDC at the SSVC. Inundation probabilities are expressed in percent. Aravena A., A. Bevilacqua, A. Neri, P. Gabellini, D. Ferrés, D. Escobar, A. Aiuppa, R. Cioni (2023).Journal of Volcanology and Geothermal Research, 438,…
Cryptotephras in the marine sediment record of the Edisto Inlet, Ross Sea: Implications for the volcanology and tephrochronology of northern Victoria Land, Antarctica
Figure 1. Maps of the study area. a) Map of Antarctica showing the locations of the studied sediment core, ice core tephra archives, and blue ice field. b) Detail of the Edisto Inlet area and location of core TR17-08. Bathymetry and land morphology are from map SS 58–60/2 (Cape Hallett),…
MISARA: Matlab Interface for Seismo-Acoustic aRray Analysis
Figure 1. Overview of Matlab Interface for Seismo-Acoustic aRray Analysis (MISARA). (a) Data preparation window for data preparation and formatting. (b) Home window, the main panel for management of all functionalities of MISARA. (c) Data pre-processing modules for data quality control. (d) Signal features modules provide access to data processing,…
Devi effettuare l'accesso per postare un commento.