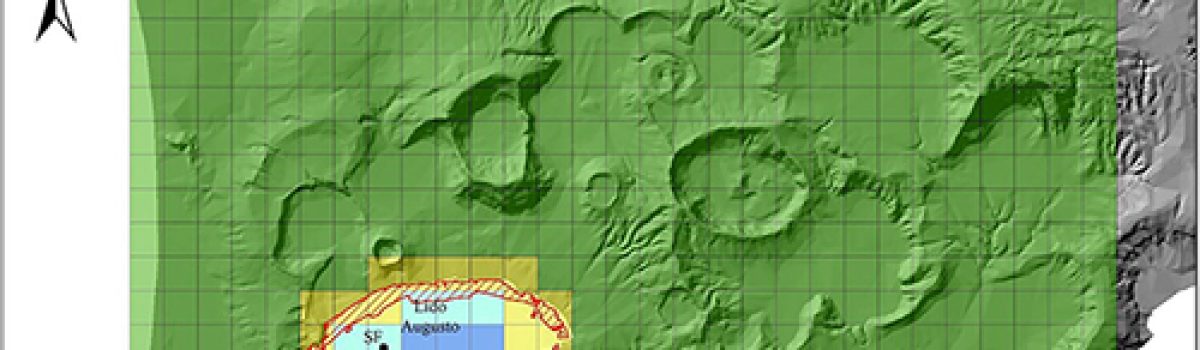
Sediment accumulation rate (SAR) for the dated locations (EP1, Cp3, B18x, Cj3, V-60-A18) in the Inner Oslofjord. The red dotted line indicates the average accumulation rate calculated for the whole fjord. (For interpretation of the references to colour in this figure legend, the reader is referred to the web version…
News
Ten years of volcanic activity at Mt Etna: High-resolution mapping and accurate quantification of the morphological changes by Pleiades and Lidar data
Map of the difference in height 2005–2015 obtained comparing the Lidar and Pleiades altimetry models. The numbers 1, 2 3, and 4 indicate the four areas mostly affected by morphological changes from 2005 to 2015. The coordinates at the corners are expressed in meters according to the WGS 84 UTM…
Multitemporal and Multisensor InSAR Analysis for Ground Displacement Field Assessment at Ischia Volcanic Island (Italy)
Figura 11. Detail of the maximum deformation zone and location of the area examined through the time series. Sentinel-1A vertical displacement map, epicentres [9] and faults [10] are also visible Beccaro L., C. Tolomei, R. Gianardi, V. Sepe, M. Bisson, L. Colini, R. De Ritis and C. Spinetti.Remote Sensing,…
Validation of a two‑layer depth‑averaged model by comparison with an experimental dilute stratified pyroclastic density current
Schematic illustration of a series of numerical simulations of the two-layer PDC model. a A two-layer PDC is generated from the inlet boundary (x=0) and flows into a proximal inclined channel with length 9.68 m (slope angle θ=6∘) and into a distal horizontal channel (θ=0∘). b There are three interfaces,…
Introduction to a community dataset from an infrasound array experiment at Mt. Etna, Italy
Infrasound waveforms recorded at Mt. Etna during July-August, 2019 and their spectrograms. Data are high-pass filtered (0.01 Hz) to remove the effect of long-period noise. (a) Ash explosion (~75–85 s) at the NEC; (b) Deep intra-crater gas explosions from BN; (c) Sequence of Strombolian explosions at the NSEC. De Angelis S., L.
The response of calcareous plankton to the Sapropel S1 interval in North Ionian Sea
Fig. 4. Stratigraphic constrained cluster analysis of selected calcareous nannofossils from core ND14Mbis for the 10.95–7.22 kyrs time interval, compared with lightness values (L*). Colour bands represent abundance values (%). Cascella A., S. Bonomo, F. Lirer, G. Margaritelli, H. Checa, I. Cacho, L. D. Pena, J. Frigola (2021).Global and Planetary…
Devi effettuare l'accesso per postare un commento.