Home
Contatti
La Sezione
Back
Chi siamo
Organizzazione
Personale
Back
Amministrazione
Amministrazione Trasparente
Info fornitori
Bandi e concorsi
INGV Pisa - Decreti e Delibere
Ricerca
Back
Attività
Linee di attività
Pubblicazioni
Back
Progetti e Convenzioni
Progetti
Convenzioni
Back
Gruppi di emergenza
Gruppi di emergenza
Infrastrutture
Back
Informatiche
Banche Dati
Calcolo Scientifico e archiviazione dati
Back
Tecniche
Laboratori
Servizi
Back
Biblioteca
Biblioteca
Back
Divulgazione e didattica
Divulgazione
Back
Area riservata
Area Riservata
Webmail
Back
Centri di monitoraggio
CME - Centro Monitoraggio Eolie
News ed Eventi
Back
Articoli
Archivio articoli
Archivio Eventi
Archivio News
l'INGV
Back
Il Portale
Organi e strutture
Sezioni e Sedi
Personale
Cataloghi e banche dati
L'INGV e le sue reti
Newsletter
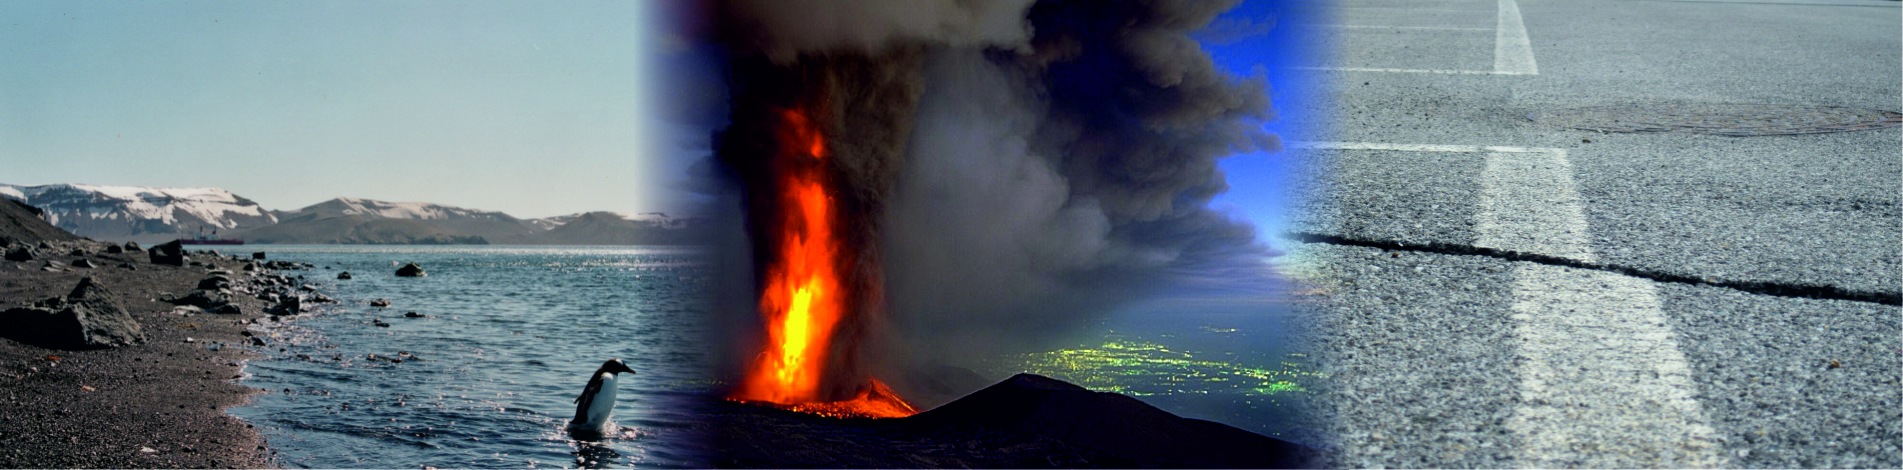
Emiliana Huxleyi
Eyjafjallanokull - Islanda
Faglia
Grotta
Duomo
Antartide - Melboune Volcano
Stazione sismica
Ambrym, Benbow
Melboune Volcano - Antartide
IN PRIMO PIANO
3 Gennaio 2017
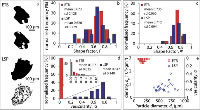
Effect of particle volume fraction on...
Del Bello E., J. Taddeucci, M.
...
3 Gennaio 2017
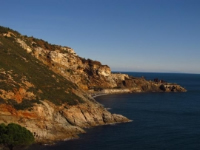
Le strutture geologiche del Calamita: laboratorio...
ElbaReport - Quotidiano d'informazione dell'Isola d'Elba
...
30 Dicembre 2016
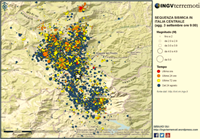
Pianificazione e gestione di un’emergenza sismica:...
Pondrelli S., A. Amato, M. Massa,
...
30 Dicembre 2016
The role of INGVterremoti blog in...
Pignone M., C. Nostro, A. Amato,
...
30 Dicembre 2016
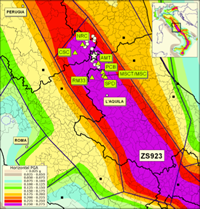
Seismic hazard in Central Italy and...
Meletti C., F. Visini, V. D’Amico,
...
30 Dicembre 2016
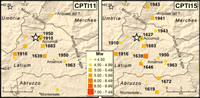
New insights in the seismic history...
Castelli V., R. Camassi, C. Caracciolo,
...
GRUPPI DI EMERGENZA
EUROVOLC VDCC
DOWNLOAD
QUICKLINKS
MULTIMEDIA
Amministrazione trasparente
Avvisi pubblici
Bandi e concorsi
Bandi di gara
Accesso civico
Atti di notifica
Close
Font Resize
A-
A+
Reset font size
Readable Font
Underline links
Highlight Links
Clear cookies
Images Greyscale
Invert Colors
Remove animations
Close
Accessibility by WAH


![Distribuzione degli effetti del terremoto del 24 luglio 1654 come riportati nel DataBase Macrosismico Italiano (DBMI11, [Locati et al., 2011])](https://www.pi.ingv.it/wp-content/uploads/2017/02/QdiG_Pondrelli_etal_fig01.png)