


The Transition From Eruption Column to Umbrella Cloud
Devenish B.J., M. Cerminara (2018)
Journal of Geophysical Research: Solid Earth, https://doi.org/10.1029/2018JB015841
Abstract
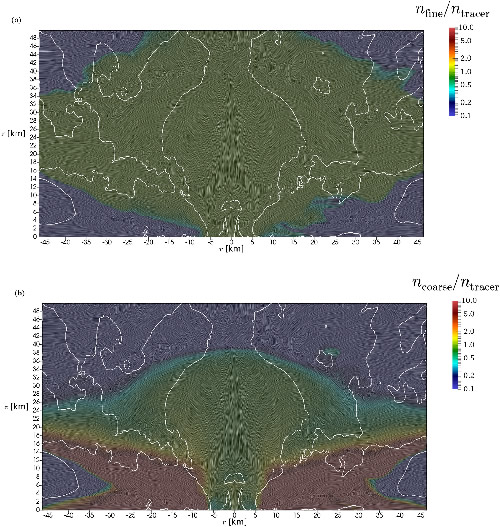
We present a coflowing integral plume model for the transition from an eruption column to an umbrella cloud. This transition occurs above the level of neutral buoyancy where the rising plume is surrounded by a descending annulus. We model this transition by extending the coflowing integral plume model of Bloomfield and Kerr (2000, https://doi.org/10.1029/2018JB015841), which was originally developed for Boussinesq fountains, to volcanic plumes. In addition to the transition region, the new model includes the part of the eruption column below the level of neutral buoyancy. The eruption column and the transition to an umbrella cloud are treated as a continuous process from the vent upward. Equations for the variation with height of the mass, momentum, enthalpy, and moisture fluxes are presented for both the upward and downward plumes. The interaction between the upward and downward plumes is accounted for by two entrainment relations: from the upward to the downward plume and vice versa; entrainment from the environment into the downward plume (or the upward plume in the absence of a downward plume) is also accounted for. The model is applied to the two eruptions considered by Costa et al. (2016, https://doi.org/10.1016/j.jvolgeores.2016.01.017) for the volcanic‐plume intercomparison study. Profiles of the mass and momentum fluxes are compared with those from an equivalent large‐eddy simulation. The new model captures the order of magnitude of the fluxes, the relative magnitudes of the upward and downward fluxes and aspects of the profiles’ shape. In particular, the upward plume reaches a maximum before decreasing toward the top of the plume consistent with the large‐eddy simulation plume.
Devi effettuare l'accesso per postare un commento.