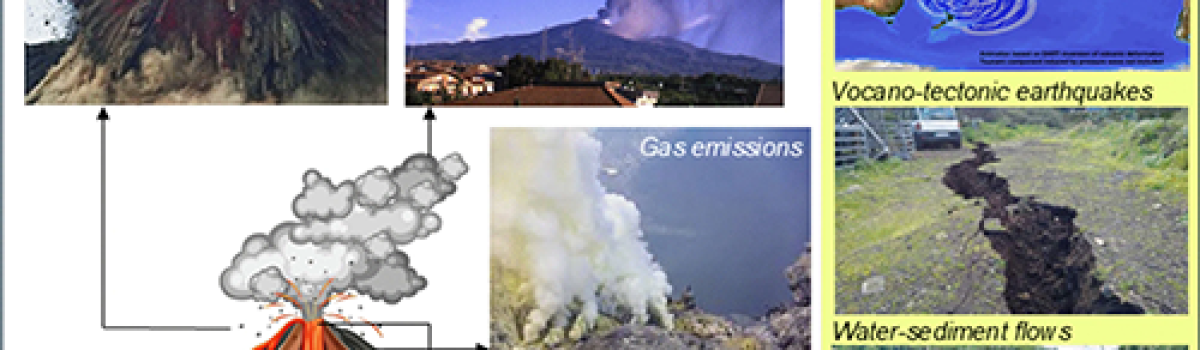
Figure 8b – Focuses on the number of earthquakes with Md > 0.5. Data are represented as red dots. Years are indicated in the labels and as black dots, marking the beginning of each year and showing the temporal evolution of the uplift. The green and blue curves indicate the two exponential…
News
How brittle detachments form and evolve through space and time
Figure 8. Time-constrained model for brittle detachments evolution. (A) crustal thinning, hinge rolling and brittle-ductile detachment zones initiation. (B) Deformation localisation along the main brittle detachment, gouge formation and development of SC structure-dominated shear zone, coeval with the onset of ductile deformation along the upper part of the exhuming granite.
The pre-Campi Flegrei caldera (>40 ka) explosive volcanic record in theNeapolitan Volcanic Area: New insights from a scientific drilling north ofNaples, southern Italy
Figure 3. a) Drilling operations in the Ponti Rossi area (February 2022). In the background, the pyroclastic deposits of the Campanian Ignimbrite (CI) and Neapolitan Yellow Tuff (NYT); b) and c) cored sediments preserved in PVC half pipes. (For interpretation of the references to colour in this figure legend, the…
About the “predecessors” of the 2023 Februaryearthquakes, Turkey
Approximate epicentral areas of the major EAFZ earthquakes of the period 1000-1900, superimposed on the 2023 seismic sequence. In red the earthquakes considered in this study. The 2023 seismicity (pink circles) comes from KOERI (Kandilli Observatory and Earthquake Research Institute); http://www.koeri.boun.edu.tr/scripts/lasteq.asp). Faults traces (red lines) from www.seismofaults.eu/; Digital…
Silica spherules in Late Pleistocene‑Holoceneglaciomarine sediments from the Ross Sea,Antarctica: insights into the formation andsignificance
Figure 1 Maps of A) Weddell Sea, and B) Ross Sea, showing the location of cores in which silica spherules were found. The cores studied in this work are highlighted in red. The figure is based on a NASA map by R. Simmon [data from the Radarsat Antarctic Mapping Project,…
From land to sea: a new high-resolution bathymetry and topography of the Campi Flegrei area, Southern Italy
Figure 2 Structure of the fishnet used for elaborating the z data acquired during the different surveys. Different colours of the tiles identify the difference source data. Gianardi R., M. Bisson, L. Cocchi, R. Isaia, S. Passaro, V. Sepe, V., & C. Spinetti, (2024). Journal of Maps, 20(1). https://doi.org/10.1080/17445647.2024.2404873…
Devi effettuare l'accesso per postare un commento.