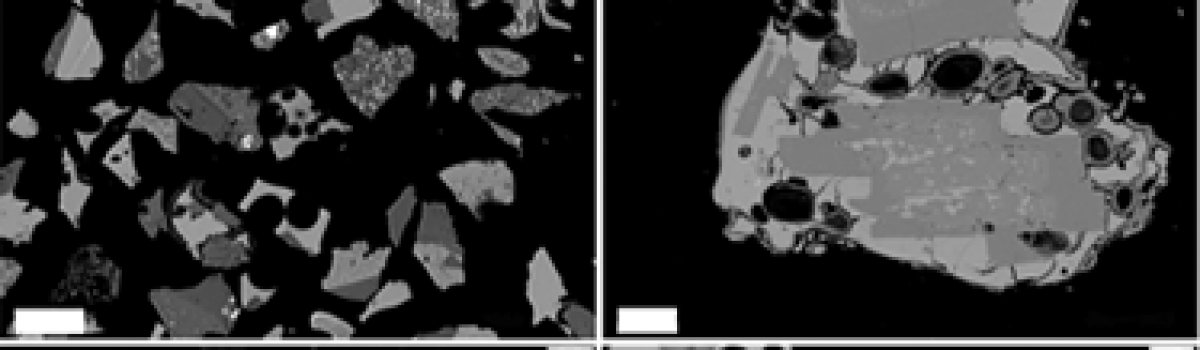
Figure 1. Location map of the sites discussed in the text. The figure shows the density track of winter storms according to ERA-Interim 1989–2009. Numerical values (number of cyclones/deg2) represent the average spatial density of cyclone centers in the winter season. Only cyclones with a minimum of 1-day duration and…
Archiviati
Speleothem U/Th age constraints for the Last Glacial conditions in the Apuan Alps, northwestern Italy
Figure 1. Glacier extent (light blue) during the LGM according to the reconstruction of Braschi et al. (1986). Sampled sites are shown in yellow. Isola I. A. Ribolini, G. Zanchetta, M. Bini, E. Regattieri, R.N. Drysdale, J.C. Hellstrom, P. Bajo, P. Montagna, E. Pons-Branchu (2019).Palaeogeography, Palaeoclimatology, Palaeoecology, 518, 62-71,…
4D simulation of explosive eruption dynamics at Vesuvius
Three-dimensional simulation of a partial column collapse scenario at Vesuvius. The input conditions of the multiphase flow model are representative of a Sub-Plinian eruption with a mass flow rate of 8 x 10’7 kg/s. Two particle classes of 30 and 500 microns were modeled to represent the ejected pyroclasts. The…
Multiphase-flow numerical modeling of the 18 May 1980 lateral blast at Mount St. Helens (USA)
Figura 1. Concentrazione totale di particelle piroclastiche nell’atmosfera (in scala logaritmica). A) Posizione iniziale del volume di magma, prima dell’esplosione. B) Rappresentazione 3D della concentrazione a 380 s dall’inizio del blast. C) Rappresentazione 2D lungo la sezione NordEst, sovrapposta alla mappa a 10 m dal suolo a 380 s. Map…
It’s alive! Virtual eruptions on a supercomputer
Some videos on the DVD can be viewed at the following YouTube channel:http://www.youtube.com/user/evivo2011 Presentation Volcanoes are not all alike: some like Mount Etna erupt frequently, while others such as Vesuvius seem quiescent, but their geological history teaches us that they can erupt even after a long…
IMEX_SfloW2D 1.0: a depth-averaged numerical flow model for pyroclastic avalanches
Figure 7. Results of IMEX_SfloW2D numerical simulations of a pyroclastic avalanche overlapped on the hill-shaded relief of the Etna summit and the boundaries of the 11 February 2014 event. Numerical parameters as follows: (a) μ=0.1, ξ=500; (b) μ=0.2, ξ=500; (c) μ=0.2, ξ=100; (d) μ=0.3, ξ=500; (e) μ=0.4, ξ=500; (f) μ=0.4,…
Devi effettuare l'accesso per postare un commento.