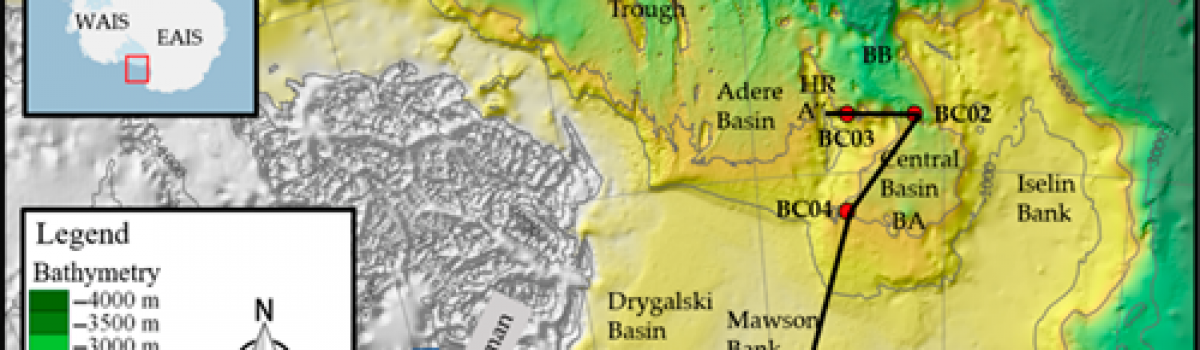
Comparison between resulting eruptive dynamics of phreatomagmatic eruptions and the equivalent simulations with no aquifer (i.e., using the same input values for water content at conduit bottom, inlet overpressure and conduit radius), as a function of the mass fraction of external water entered into the conduit. (a) Ratio of mass…
News
Evolution of Conduit Geometry and Eruptive Parameters During Effusive Events
Temporal evolution of effusion rate (a–b), erupted mass (c–d), and reservoir overpressure (e–f). (left) Simulations A–E. (right) Simulations F–J. Aravena A., R. Cioni, M. de’ Michieli Vitturi, M. Pistolesi, M. Ripepe, A. Neri (2018).Geophysical research Letters, 45/15, 7471-7480, https://doi.org/10.1029/2018GL077806. Abstract The dynamics of effusive events is…
Observation and analyses of shear wave splitting at the Larderello-Travale geothermal field, Italy
Fig. 1. Map of seismicity recorded during the GAPSS experiment. Epicenters are represented by dots, whose size is proportional to magnitude and color represents depth according to the colorbar at the bottom left. Black triangles represent seismic stations used in this study. Black arrows indicate the direction of…
Evolution of shear zones through the brittle-ductile transition: The Calamita Schists (Elba Island, Italy)
Simplified geological map of southeastern Elba Island (modified after Papeschi et al., 2017). Squares highlight the location of the two studied sections. CNT: Capo Norsi thrust. CSZ: Calanchiole shear zone. FSZ: Felciaio shear zone. ZF: Zuccale fault. Mineral abbreviations: Ab: albite; And: andalusite; Bt: biotite; Crd: cordierite; Di: diopside; Wmca:…
Last Interglacial Sea-level highstand deduced from notches and inner margins of marine terraces at Puerto Deseado, Santa Cruz Province, Argentina
Figure 1. Location map of the studied area Bini M., G. Zanchetta, A. Ribolini, M.C. Salvatore, C. Baroni, M. Pappalardo, I. Isola, F.I. Isla, E. Fuck, G. Boretto, C. Morigi (2017).Geografia Fisica e Dinamica Quaternaria, 40/1, 29-39, doi: 10.4461/GFDQ.2017.40.3. Abstract A detailed geomorphological survey was undertaken…
Relation between alternating open/closed-conduit conditions and deformation patterns: An example from the Somma-Vesuvius volcano (southern Italy)
Figure 1. Geological map of the southern sector of the Campanian Plain and Somma-Vesuvius volcano (after Vitale and Ciarcia, 2018 modified). WGS84-UTM Projection. Tramparulo F.D.A. , S. Vitalea, R. Isaia, A. Tadini, M. Bisson, E.P. Prinzi (2018).Journal of Structural Geology, 112, 138-153, https://doi.org/10.1016/j.jsg.2018.05.008. Abstract We…
Devi effettuare l'accesso per postare un commento.