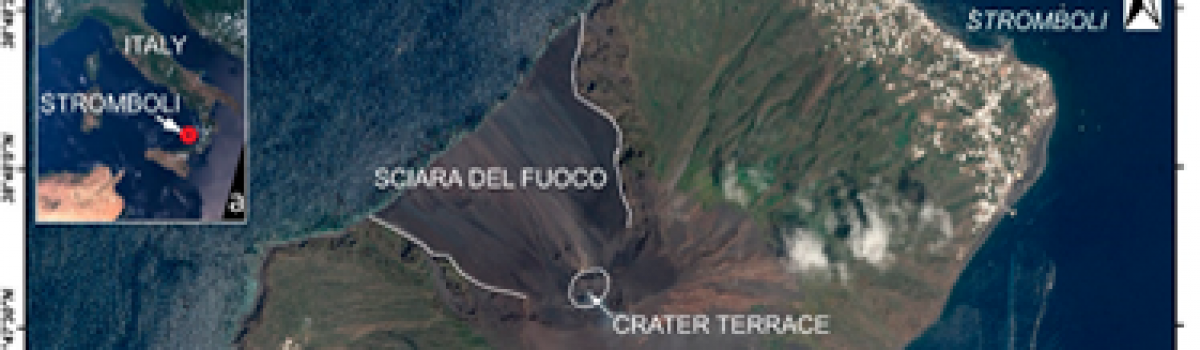
Detailed geological map of the study area along the northeastern shore of Golfo Stella and location of dated samples. The main brittle and brittle‐ductile deformation zones of the area are indicated. (a) Location of sample ELB2 in the serpentinitic and nonmetamorphic hanging wall of the Capo Norsi‐Monte Arco Thrust. (b)…
News
PeakLocator 1.0, a web tool to compare extreme value areas among maps
Schematic representation of the PL1.0 procedure considering the maps of the variable 1 and 2, whose areas of extreme values are A1,1 and A2,1, obtained setting alfa1=alfa2=1. We remark that, in the insert representing the output, the bounded grey area represents the region where the values of both the variables…
Magmatic reactivation of the Campi Flegrei volcanic system: insights from the Baia–Fondi di Baia eruption
a) Overview of the Campi Flegrei caldera with the main locations and eruption vents cited in the text. b) Google Earth image showing the inferred vents for the Baia and Fondi di Baia eruptive sequences (with dashed lines. Map data: SIO, NOAA, U.S. Navy, NGA, GEBCO, TerraMetrics, ©2018 Google) Voloschina…
Physical constraints for effective magma-water interaction along volcanic conduits during silicic explosive eruptions
Comparison between resulting eruptive dynamics of phreatomagmatic eruptions and the equivalent simulations with no aquifer (i.e., using the same input values for water content at conduit bottom, inlet overpressure and conduit radius), as a function of the mass fraction of external water entered into the conduit. (a) Ratio of mass…
Evolution of Conduit Geometry and Eruptive Parameters During Effusive Events
Temporal evolution of effusion rate (a–b), erupted mass (c–d), and reservoir overpressure (e–f). (left) Simulations A–E. (right) Simulations F–J. Aravena A., R. Cioni, M. de’ Michieli Vitturi, M. Pistolesi, M. Ripepe, A. Neri (2018).Geophysical research Letters, 45/15, 7471-7480, https://doi.org/10.1029/2018GL077806. Abstract The dynamics of effusive events is…
Observation and analyses of shear wave splitting at the Larderello-Travale geothermal field, Italy
Fig. 1. Map of seismicity recorded during the GAPSS experiment. Epicenters are represented by dots, whose size is proportional to magnitude and color represents depth according to the colorbar at the bottom left. Black triangles represent seismic stations used in this study. Black arrows indicate the direction of…
Devi effettuare l'accesso per postare un commento.