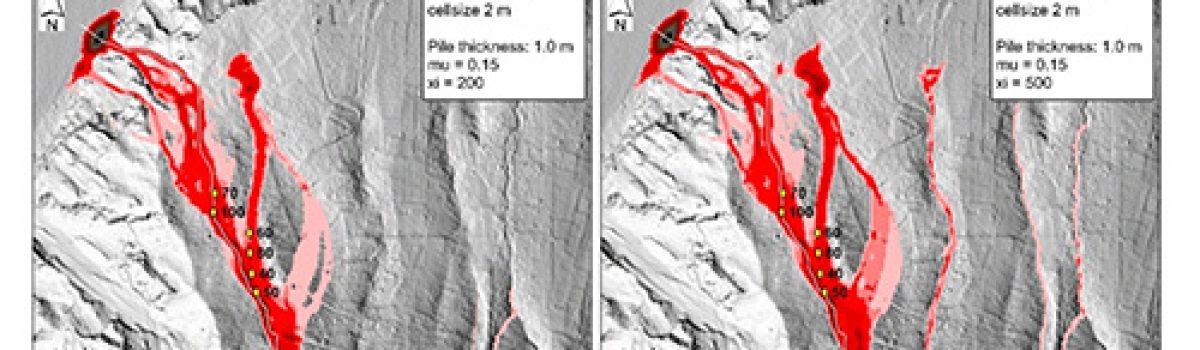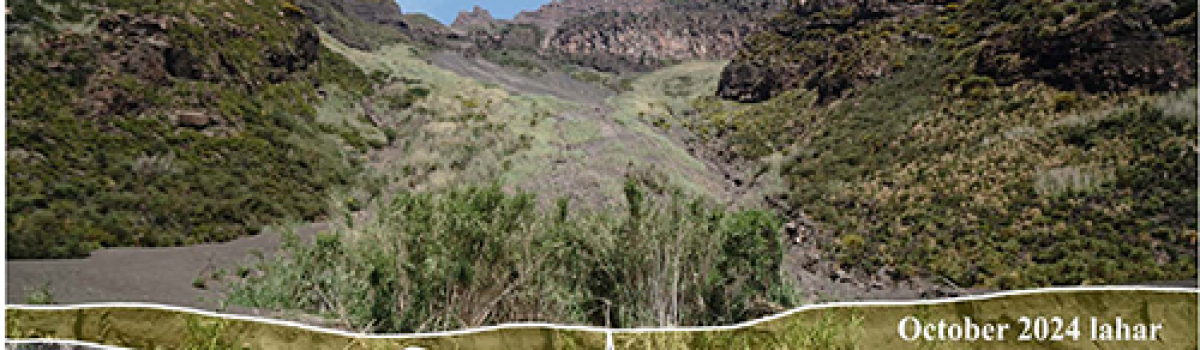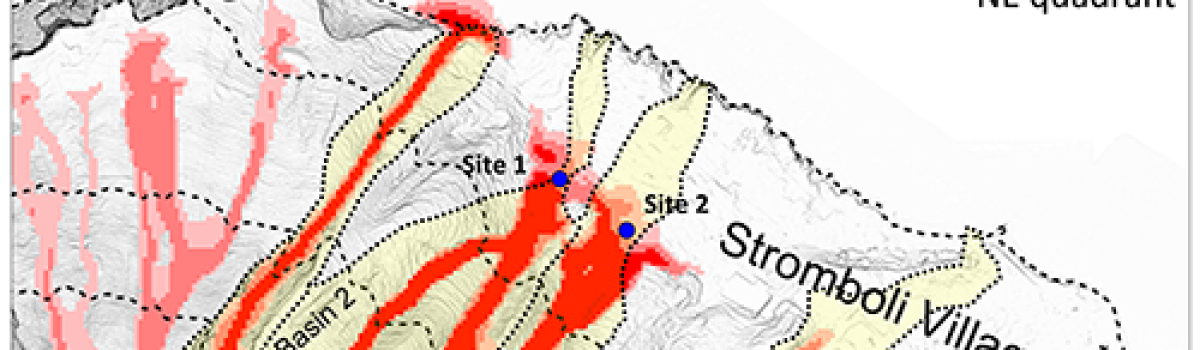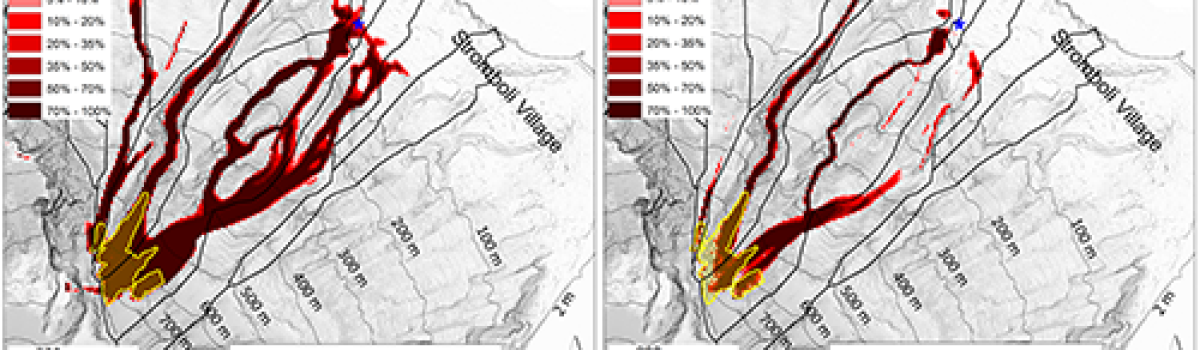
Probabilistic reconstruction of the areas invaded by the dense current of the 1930 PDC event, showing the likelihood of exceeding (a) 0.1 and (b) 1 m flow thickness threshold during the entire propagation. In panel (c) we show the mean value of maximum flow thickness, and in panel (d) the mean value of the maximum…
News
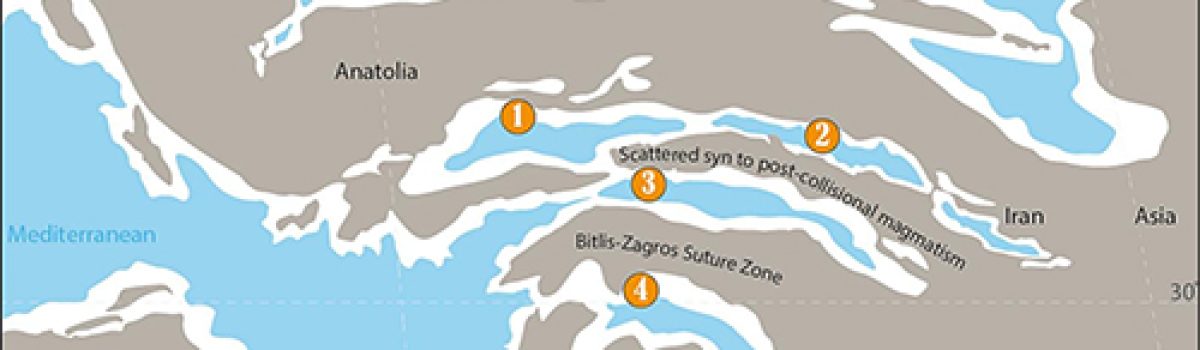
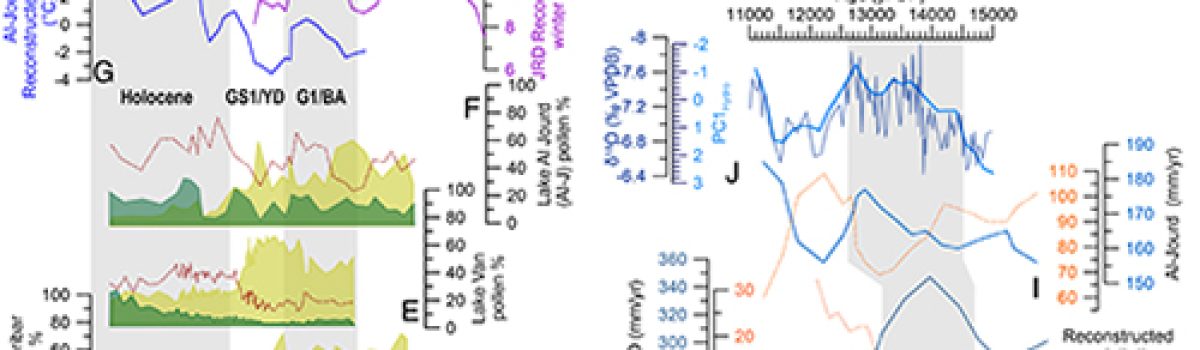
Magneto-biostratigraphic dating of the marine-terrestrial transition in the Miocene Sivas Basin (Central Anatolia): Implications for Neo-Tethys seaway closure and Eurasia-Arabia collision
Fig. 9. a) Simplifield paleogeographic reconstruction of the eastern Mediterranean region during the middle Burdigalian, modified from Palcu et al. (2023). The figure illustrates the terminal stage of Neo-Tethys marine connectivity and the early collision between Arabia and Anatolia. Magmatism north of the Zagros suture is represented as localized…
Central Mediterranean tephrochronology and explosive volcanism over the240–190 ka interval: Insights from the high-resolution record of CastiglioneMaar, central Italy
Figure 3 Composite sequence tephrostratigraphy for the studied Marine Isotope Stage (MIS) 7 interval. The figure illustrates the stratigraphic positions of the studied tephra layers plotted against composite depth (m). High-resolution photographs display representative tephra layers from core C1-C2 (highlighted by red rectangles), illustrating their primary stratigraphic features and visual…
Cognitive biases and rational decision making for volcanichazards and risks
Table 1 Cognitive biases described in this contribution. Papale P. (2026).Frontiers in Earth Science, 14 pp. https://doi.org/10.3389/feart.2026.1755833 Open access Abstract Volcanic systems are governed by complex, non-linear dynamics that make deterministic forecasting impossible and require decisions to be made under substantial uncertainty. This…
Gully system evolution in volcanic environments through digital elevation model comparisons: A case study from La Fossa Cone (Vulcano Island, Sicily)
Figure 3 Difference of DEM map over the entire monitoring period, showing the main topographic changes on the NW gully system from 2010 to 2022. The difference map of the DEMs is overlaid on the 2022 DSM hillshading. Consequently, the areas that appear gray on the map correspond to the…
Quantifying Gas and Thermal Energy Emissions in an Active Geothermal Area: Insights From Le Biancane (Larderello Field, Italy)
Resulting maps of a) Soil CO 2 flux; b) Soil temperature; and c) Thermal gradient in the Le Biancane area; d) Schematic representation of the various terms of the thermal balance at the surface soil of a heated from below area. The thicker solid arrows represent the terms that supply…
Devi effettuare l'accesso per postare un commento.