



Collection of simplified maps of ballistic projectile distribution for major explosions and paroxysms at Stromboli
Andrea Bevilacqua, Patrizia Landi, Paola Del Carlo, Augusto Neri, Massimo Pompilio. https://doi.org/10.13127/stromboli/strballistics
- Istituto Nazionale di Geofisica e Vulcanologia, Sezione di Pisa, Pisa, Italy
This dataset examines the distribution and characteristics of areas affected by ballistic fallout from major explosions and paroxysms at Stromboli. By analyzing historical and recent explosive events, it provides detailed information on the distances, directions, and extents of ballistic fallout, including associated uncertainties. The data draws from scientific literature, monitoring records, and field observations, offering a comprehensive perspective on ballistic dispersal patterns at Stromboli.
Two pre-existing catalogs inform this study. The “historical catalog” (Bevilacqua et al., 2020) covers 36 paroxysms from 1879 to 1960, based on over a hundred literature sources. The accompanying Supporting Material S1 provides excerpts from original sources, offering unedited information on the ballistic fallout of the historical paroxysms. We mapped 20 of these paroxysms, while the major explosions listed in the historical catalog were not possible to map because of insufficient data. The “recent catalog” (Bevilacqua et al., 2023) documents Stromboli’s explosions over the ca. fifty years from 1970 to 2023. This recent dataset includes 51 major explosions and 4 well documented paroxysms, enabling us to map 43 of these major explosions and all the paroxysms.
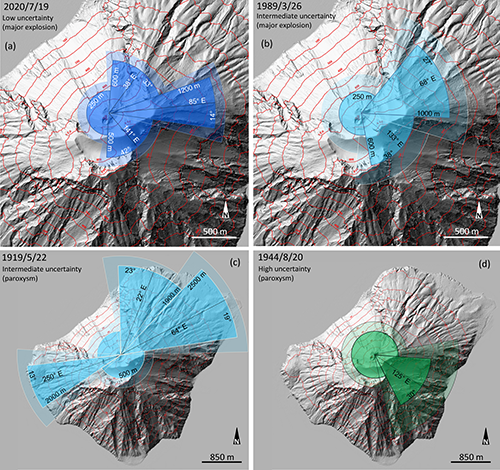
Our analysis refrains from modeling the multiphase explosive mixture at the source or projectile dynamics, although available knowledge on projectile dynamics in the literature was considered in defining the lower limit of the clast size. We exclusively relied on available data from remote observations, field reports, eyewitness accounts, and surveillance imagery. The present dataset categorizes each explosion’s ballistic fallout area by mapping it with circular sectors. These sectors represent areas affected by the largest projectiles (lithic and scoria clasts exceeding 5-10 cm), while smaller clasts and pumice fallout are not considered. The distribution of projectiles is mapped using maximum distances and directional dispersal patterns, and the areal density distribution of the projectiles was not considered in this analysis.
Each mapped event includes a central axisymmetric zone – a circle representing proximal areas around Stromboli’s craters where ballistic impacts occurred radially. For major explosions, the radius of this area is typically 250 m but extends up to 500 m for some events. Paroxysms have larger affected zones, with typical radii of 700 m and up to 900 m. Beyond the proximal area, each event includes 1-3 circular sectors, where radial distances can vary more widely: from 300 to 1200 m for major explosions and from 700 to 2500 m for paroxysms. The circular shape of the sector is a conservative choice to represent the areas affected by ballistic fallout in the distal zones, because the directed blasts may also produce roughly elliptical shapes. This shape effect is mitigated by the introduction of the uncertainty areas on the boundary of the circular sectors. The study uses polar coordinates centered at 518400 E, 4293900 N (UTM WGS84, Zone 33N), approximating the center of the Crater Terrace. The involvement of distinct and/or multiple craters in the different events is included in the radial uncertainty detailed below.
The accuracy of these maps is graded into three uncertainty classes: low, intermediate, and high. Low uncertainty corresponds to major explosions with relatively precise data and mapped fallout areas, while moderate and high uncertainties apply to events with directional data but less accurate distance measurements. Low uncertainty events have an error range of 0-100 m in radial distance, while moderate and high classes have a broader range of 0-200 m. For high uncertainty events, only related to the historical paroxysms, a wider range, up to 0-600 m, is adopted where ballistic projectiles affected lower portions of the island without specific distance data. Angular uncertainties are scaled differently for major explosions and paroxysms, reflecting the larger geographic scope of paroxysmal events.
This dataset is accompanied by two supporting tables summarizing the key pieces of information that we used for mapping the major explosions and the paroxysms, respectively. These tables detail: (i) literature sources describing the event, (ii) calendar time, inter-event time, GMT hours of the onset of the events, (iii) the class of uncertainty of the maps, (iv) a short description of the ballistic projectiles dispersal area and a reference to previously existing maps of the products, (v) the damage caused and people affected, (vi) the occurrence of PDCs and/or tsunamis related to the considered events. More specifically, the table related to major explosions details information from field surveys and from cameras, whereas the table related to the paroxysms includes excerpts from the original documents.
In summary, this dataset supports the characterization of ballistic fallout zones for historical and recent explosive events at Stromboli. The mapped fallout zones – defined by uncertainty classes and derived from circular sectors – detail the conditional hazard based on projectile reach. These findings contribute to an improved understanding of the spatial patterns associated with Stromboli’s ballistic activity. The dataset is open: additional maps and improvements of the current maps are planned as new data will become available.
[sp_easyaccordion id=”277878″]
Devi effettuare l'accesso per postare un commento.