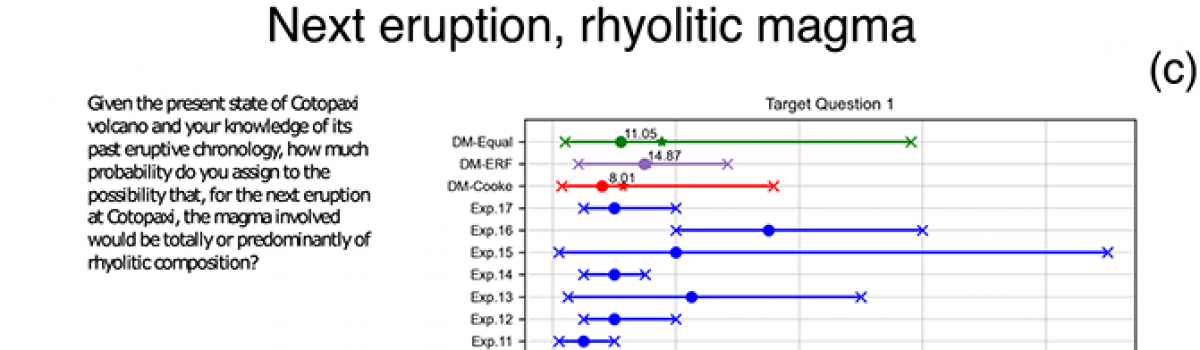
Fig. 3B In the uppermost part of the section, the pumice lapilli deposit inversely grades into a c. 50 cm-thick bed made of decimeter-sized, dark brown to reddish pumice bombs (Fig. 3b). Lithic fragments are present but scarce along the entire sequence and are mainly represented by red-oxidized clasts and…
News
INSTANCE – the Italian seismic dataset for machine learning
Figure 14. Example of randomly selected earthquake waveforms of the broadband HH channels contained in INSTANCE. Each rowcontains three randomly selected traces drawn according to the following criteria: (a-c) earthquakes 2≤M…
Comparison of deep learning techniques for the investigation of a seismic sequence: an application to the 2019, Mw 4.5 Mugello (Italy) earthquake
Figura 1.a) Seismic stations belonging to the INSN permanent (IV) and to the additional temporary network (9M). Blue and red colours denote which stations are being used in catalogs MIV and M9M, respectively. See text for details. b) Mw=4.5, December 09 2019 mainshock focal mechanism (http://cnt.rm.ingv.it/event/23558121, Scognamiglio et al. (2006))…
Destructiveness of pyroclastic surges controlled by turbulent fluctuations
a) Lateral view of an advancing experimental pyroclastic surge at the eruption simulator PELE.b)Schematic sketch of the internal flow structure shown in Fig. 1a. This illustrates the longitudinal subdivision of the gravity current into the frontal head and trailing body regions; and the vertical structure of the gravity current where…
Accumulation and distribution of microplastics in coastal sediments from the inner Oslofjord, Norway
Sediment accumulation rate (SAR) for the dated locations (EP1, Cp3, B18x, Cj3, V-60-A18) in the Inner Oslofjord. The red dotted line indicates the average accumulation rate calculated for the whole fjord. (For interpretation of the references to colour in this figure legend, the reader is referred to the web version…
Ten years of volcanic activity at Mt Etna: High-resolution mapping and accurate quantification of the morphological changes by Pleiades and Lidar data
Map of the difference in height 2005–2015 obtained comparing the Lidar and Pleiades altimetry models. The numbers 1, 2 3, and 4 indicate the four areas mostly affected by morphological changes from 2005 to 2015. The coordinates at the corners are expressed in meters according to the WGS 84 UTM…
Devi effettuare l'accesso per postare un commento.