


https://www.sciencedirect.com/science/article/pii/S0377027320303723?dgcid=coauthor Anyone clicking on this link before December 04, 2020 will be taken directly to the final version of the article on ScienceDirect. No sign up, registration or fees are required. Share Link: https://authors.elsevier.com/c/1bvju1LkU3Vr1h Bagnato E., G. Tamburello, D. Granieri, S. Caliro, F.
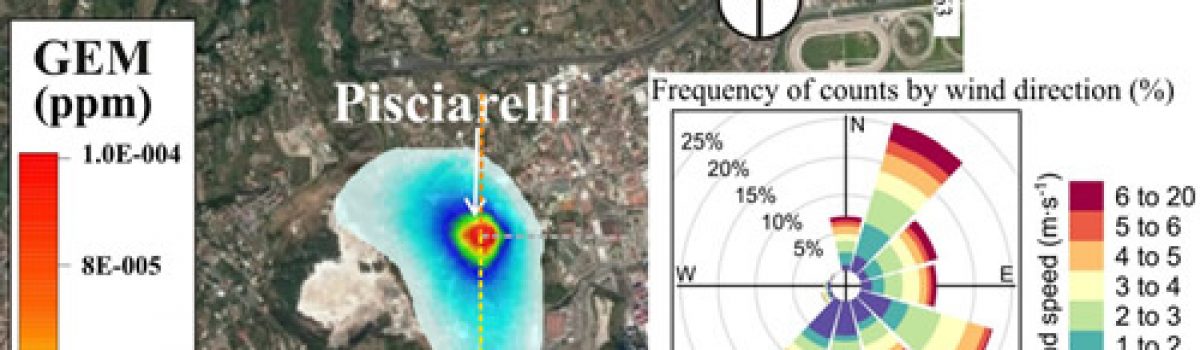
First simultaneous mercury and major volatiles characterization of atmospheric hydrothermal emissions at the Pisciarelli’s fumarolic system (Campi Flegrei, Italy)
Read More

Devi effettuare l'accesso per postare un commento.