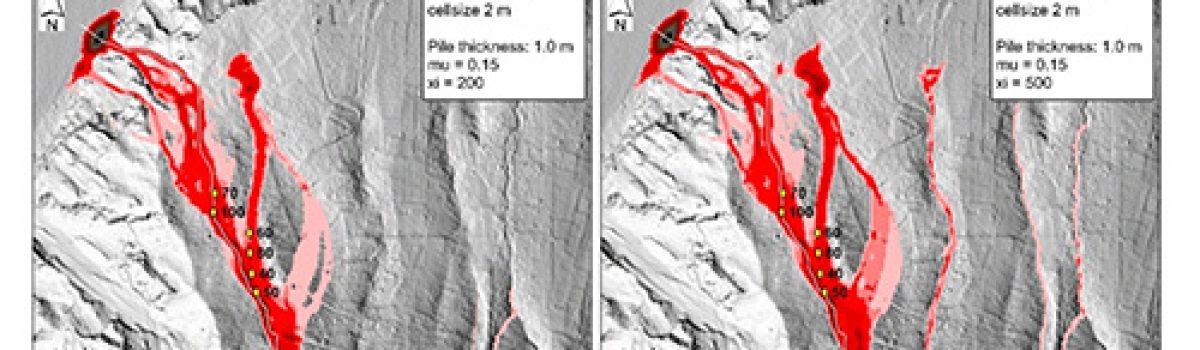
Resulting maps of a) Soil CO 2 flux; b) Soil temperature; and c) Thermal gradient in the Le Biancane area; d) Schematic representation of the various terms of the thermal balance at the surface soil of a heated from below area. The thicker solid arrows represent the terms that supply…
News
High-frequency volcano seismic tremor at Mt. Etna, Italy: Insights from varying seismic-acoustic amplitude ratios
Figure 5.1. Detailed overview of a one-hour long record of data including an episode of high-frequency tremor, including spectral, amplitude, and trend analysis in both time and frequency domains. Panels (a) and (b) show the seismic spectra and waveform coherency-based tremor detection (spectral width), respectively. Acoustic spectral content is displayed…
Twenty‐Five Years of Probabilistic Fault DisplacementHazard Assessment
Figure 3. Block diagram illustrating principal and distributed ruptures in a normal faulting tectonic setting. The diagram highlights the spatial distribution of surface ruptures, with the principal rupture (PF) occurring along the main fault and distributed ruptures (DR) appearing as secondary surface breaks, typically in the hanging wall and footwall…
The nucleation and growth of mixed H2O–CO2 bubbles in magmas
Figure 4. The critical pressure required for nucleation of bubbles in mixed H2O–CO2 systems… Sullivan P., E.W. Llewellin, F.B. Wadsworth, S. Colucci, H. Kusumaatmaja (2026).Journal of Volcanology and Geothermal Research, Volume 472. https://doi.org/10.1016/j.jvolgeores.2026.108538 Abstract Volcanic eruptions are driven by the nucleation and growth of gas bubbles…
Infrasound Array Dataset of the 2021 Eruptive Paroxysms of Etna Volcano
Figure 6 Waveform and spectral characteristics of infrasonic signals from South-East crater and Bocca Nuova/ Voragine craters. a-c). Representative normalized infrasonic waveforms from seven explosive events at the SE and BN/VOR craters are shown. Individual waveforms are depicted in light grey, while the ensemble average is indicated in red. (b-d)…
Tracking Subsurface Changes via Frequency Shifts in Volcanic Tremor Spectral Lines:Observations From Mt Etna
Figure 1 Overview of seismic network at Etna volcano and recorded tremor in 2020. (a) Seismicstations (triangles) on Etna, with used stations highlighted pink. Broader tectonic context shown inadjacent map (red box corresponding to region shown). Local earthquakes (≥ML2.5) are shown assmall circles, colored by date (see legend). Lateral…
Devi effettuare l'accesso per postare un commento.