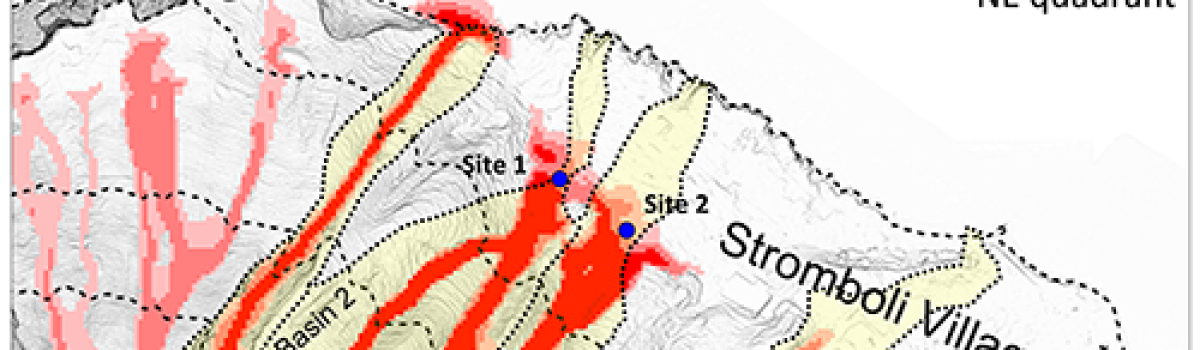
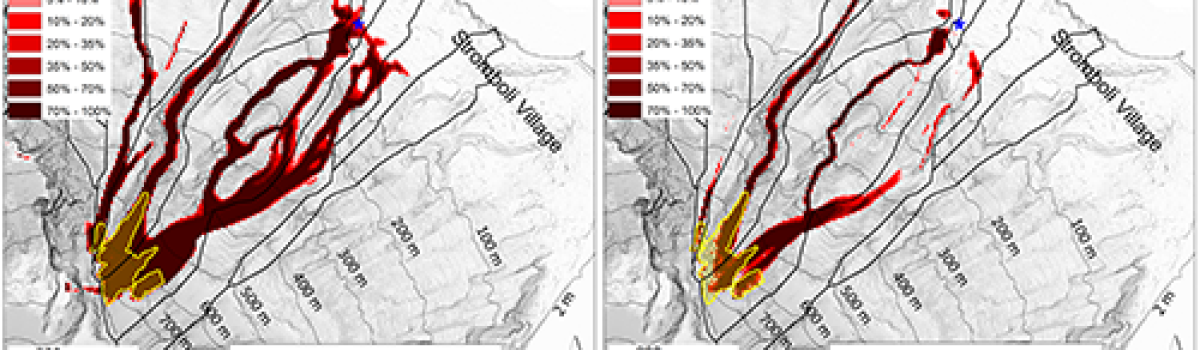
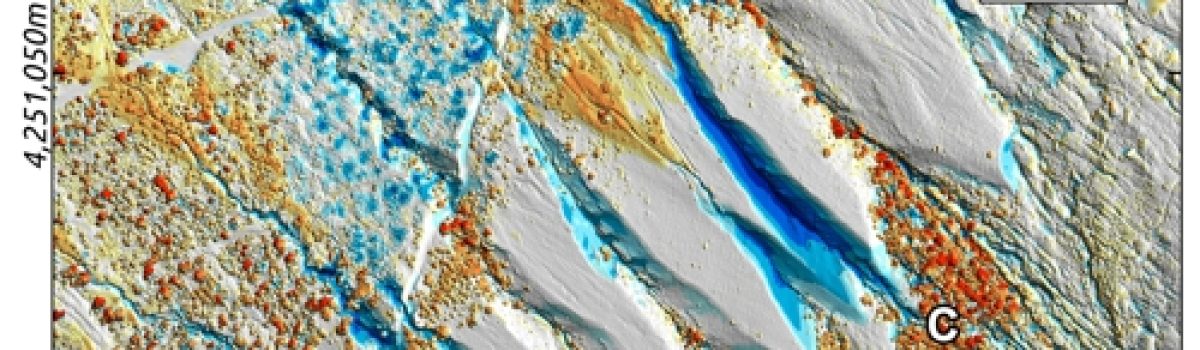
Figure 4 Example of infrasonic calving event correlated with photo images. (a) Calving eventwaveform, onset 9:57:56 UTC. (b) Spectrum of the signal recorded by four sensors showing amain peak around ~3 Hz preceded by a higher frequencies ~10 Hz. (c) Back-Azimuth from signalin a. The red colors indicate the lager…
News
Self-similar spatial clustering of volcanic vents: Insights into magma storage depth from global volcanic fields
Figure 5 Gaussian Bivariate Kernel estimation for: a) Al Haruj volcanic field; b) Boring volcanic field; c) South Auckland volcanic field and d) Jeju volcanic field. The spatial distributions of these volcanic fields are in Table 3. Francesco Mazzarini, Nicolas Le Corvec, Ilaria Isola (2025).Journal of Volcanology and Geothermal…
Holocene palaeoclimatic evolution in the North Ionian Basin of the Mediterranean Sea: A multiproxy approach
Figure 6. Cold water group (CWG) signal analysis displayed in the time domain. In (a) is shown the comparison between the IMF3 and the abundance of CWG (%). The IMF3 periodogram (b) and continuous wavelet transform power spectrum (c) are displayed. In the periodogram (b), significant periodicity and relative values…
Filling the gap of the late Quaternary planktonic foraminifera record in the Western Mediterranean: Paleoceanographic changes in the Ligurian Sea over the last 27.4 ka
Figure 5. Schematic rappresentation of the planktonic foraminifer distribution and seasonal water-column dynamics from the Late Pleistocene (excluding interstadials) through the Early/Middle Holocene to the Late Holocene in the Ligurian sea (core NDT_22_2016). It must be noted that changes in planktic foraminifer distribution between periods were progressive. Martinelli P.,…
Geophysical fingerprint of the 4–11 July 2024 eruptive activity at Stromboli volcano, Italy
Figure 7 Multidirectional hillshade plots of Stromboli’s crater area: (a) 4 July 2024 (Civico et al., 2025), (b) 14 July 2024 (Civico et al., 2024b, c), and (c) map of elevation difference (DEM of differences), highlighting morphological changes between 4 and 14 July 2024. Purple areas indicate material loss, whereas orange areas indicate material gain. Zuccarello…
Past intrusion of Circumpolar Deep Water in the Ross Sea: Impacts on the ancient Ross Ice Shelf
Fig. 1. Map of the study area showing the position of the cores, seismic profile and oceanic features.(A) Focus on the JOIDES Trough with respect to the position of cores TR17-02 and GRT23-MC1 over the seismic profile SP1 (red line, fig. S1). The brown line indicates the maximum extent of…
Devi effettuare l'accesso per postare un commento.