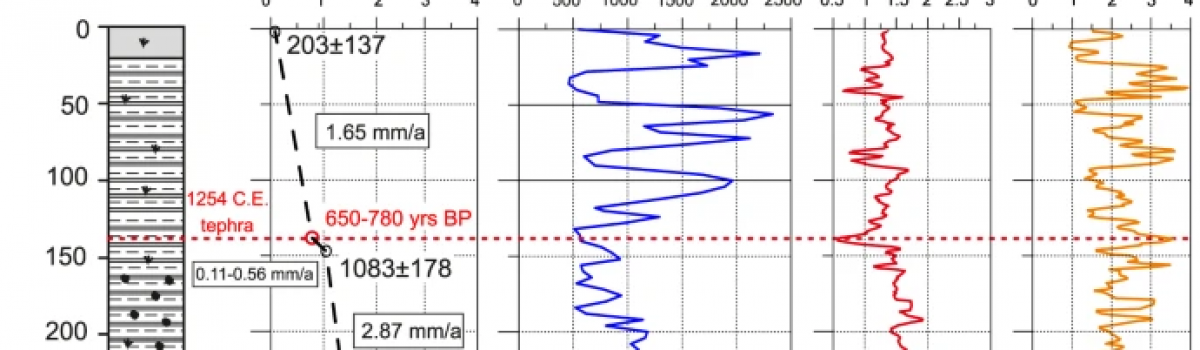
Figure 2.Pictures showing the tephra and tsunami sequence in (A) Trench 3, (B) Trench 2, and (C) Trench 1. (D) A detail of Upper Tsunami deposit (UTd) and T2 tephra from Trench 2. Tool for scale is 30 cm. One Euro coin in (A) for scale is 23.25 mm. The red arrow…
Archiviati
The Transition From Eruption Column to Umbrella Cloud
Figure 6. Streamlines of the time‐averaged vertical velocity for the large‐eddy simulation plume for the weak eruption with filled contours of fine (top) and coarse (bottom) ash fractions (relative to the mass fraction of tracer particles) superimposed. The white lines indicate contours of zero vertical velocity separating regions of positive…
Long and short-term magma differentiation at Mt. Etna as revealed by Sr-Nd isotopes and geochemical data
Figure 10. Temporal variation of (a)87Sr/86Sr, (b) Rb/Th, c) Rb/La of CC-type and DDF-type Etnean magmas erupted since 1329 (Corsaro and Cristofolini, 1993; Corsaro et al., 1996; Tonarini et al., 2001; Armienti et al. 2004; Viccaro and Cristofolini, 2008, Corsaro et al., 2009a, Corsaro et al., 2013, Nicotra and Viccaro,…
The role of viscoelastic stress transfer in long-term earthquake cascades: Insights after the Central Italy 2016–2017 seismic sequence
Figure 1. Map of Mw ≥ 6 historical earthquakes along the Apennine mountain chain starting from 1400 CE (from the catalogue CPTI15; Rovida et al., 2016). Black empty circles represent the events located outside the 30‐km half width along the trace of the section (red dashed line) and not considered…
Variable Fault Geometry Suggests Detailed Fault‐Slip‐Rate Profiles and Geometries Are Needed for Fault‐Based Probabilistic Seismic Hazard Assessment (PSHA)
Fault scarps exposed at the surface in the central Italian Apennines formed since the end of the last glacial maximum (LGM). (a) Photograph of a postglacial scarp with example of a scarp profile line; (b) cartoon topographic scarp profile constructed across cartoon fault scarp showing how the throw since the…
Dynamics of shallow hydrothermal eruptions: new insights from Vulcano’s Breccia di Commenda eruption
Three-dimensional view of the eruption sequence after 3.5, 15, 20, 30, 40 and 50 s. Colour scale represents the logarithm in base 10 of the pyroclasts concentration (alpha), along a W–E section and at ground level. Ballistic particles of 8, 16 and 30 cm are drawn with different diameters and…
Devi effettuare l'accesso per postare un commento.